There are many advanced tools, indicators, and potential options for traders to use. That’s why utilising a technical analysis tool like Bollinger Bands can be so beneficial. Whether you’re just getting started on your trading journey or an experienced investor, understanding trading tools is an important skill. This article will explore what Bollinger Bands are, how to use them best, and their limitations.
What are Bollinger Bands?
Bollinger Bands are one of many technical analysis indicators used by experienced traders. These trading bands are primarily used to assess whether an asset is overbought or oversold. They can also help determine the volatility of a financial instrument. Understanding these factors can be a great way for traders to analyse the risk factor of investing in a certain cryptocurrency.
Bollinger Bands were pioneered and trademarked in the 1980s by – you guessed it – a man named John Bollinger. Bollinger is a seminal trader who set out to craft a tool that could reliably show investors if an asset was overbought or oversold, and its level of volatility. He also wrote a book, Bollinger on Bollinger Bands, that runs through the optimal use case of his technical indicator.
How do the Bollinger Bands work?
Bollinger Bands consist of three important lines placed across a trading chart (Figure 1). The first line to understand is the simple moving average (SMA), which can visually be identified as the “middle line”. The simple moving average is based on the average of an asset’s price over a customisable period.
On either side of the SMA are the two Bollinger Bands. These are either positive (the upper band) or negative (the lower band) standard deviations based on the SMA, although the exact figure can be adjusted.
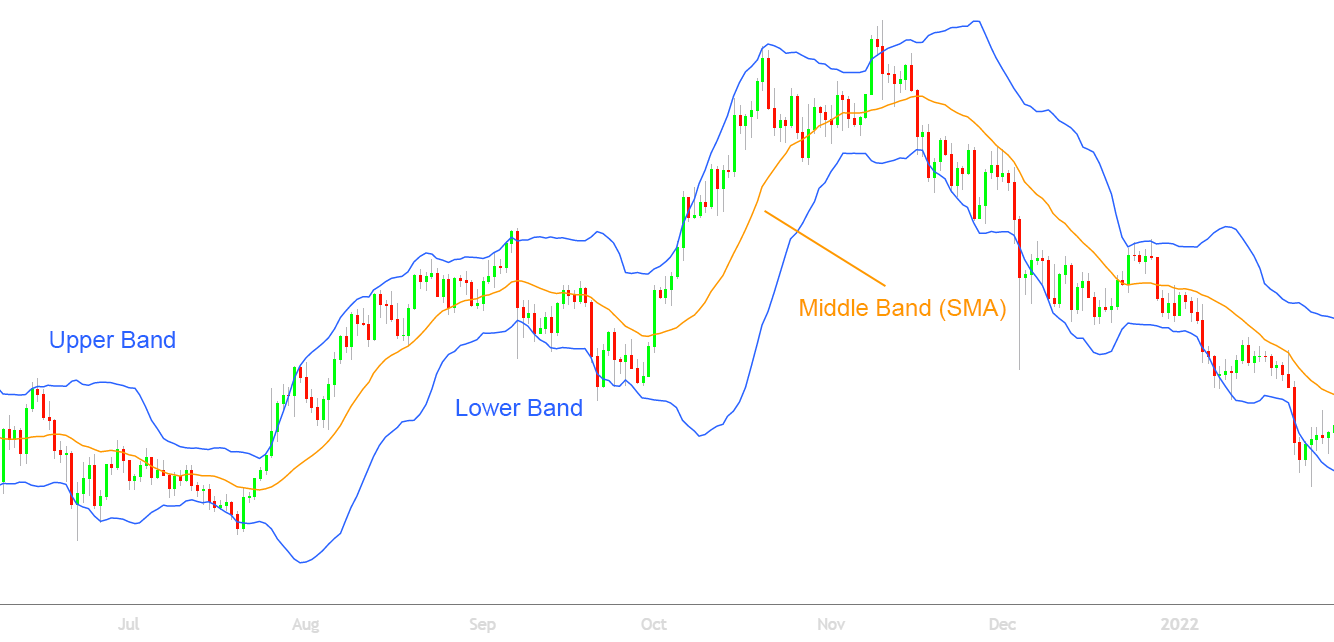
Figure 1 – The three lines that make up the Bollinger Bands
Bollinger Bands draw heavily from the Relative Strength Index (RSI), a similar type of technical indicator that was developed a few years earlier. Investors can use the RSI and Bollinger Bands together to see a broader picture of an asset’s trends.
How to interpret Bollinger Bands?
Bollinger Bands can be read differently depending on the trader’s settings and personal investment goals. The simplest way to interpret them is by looking at the actual price of an asset relative to the upper and lower Bollinger Bands. If the price hits or breaches the upper bands, this indicates the instrument is overbought and the price is likely to correct downwards. On the other hand, the price hitting or breaching the lower band suggests an oversold asset and a looming price increase. However, these technical indicators are better suited to short or mid-term trends. The width of the Bollinger band is determined by finding the difference between the upper and lower bands divided by the middle band.
Bollinger Bands can also be used to identify price volatility. Simply put, the greater the gap between the two Bollinger Bands, the higher the volatility.
Key Takeaway
One way to think of Bollinger Bands is like throwing a bouncy ball between two walls. When the ball (price) hits the wall (band), it’s likely to ricochet in the opposite direction. However, the greater the distance between the walls (volatility), the longer the ball will take to hit the opposite wall, if it does at all.
What are the best settings for Bollinger Bands?
Bollinger Bands have two main functions that can be adjusted – changing the SMA periods (length) and changing the standard deviation multiplier (Figure 2). The SMA will create a moving average based on the last 20 periods (or candles) of price movement by default.
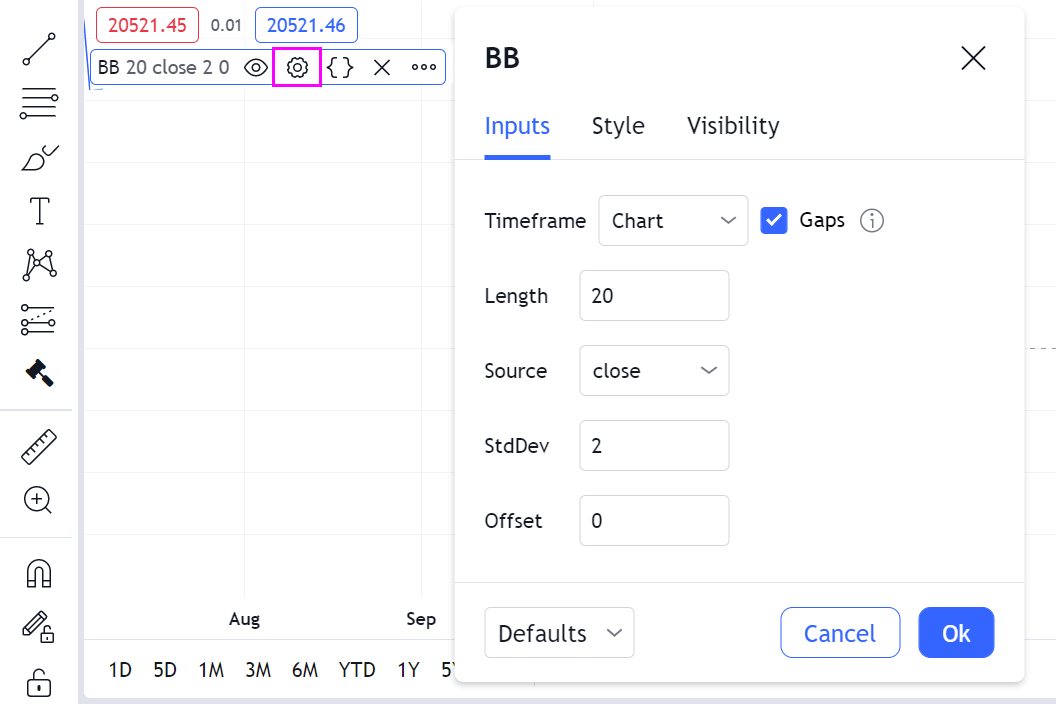
Figure 2 – The settings menu for Bollinger Bands on TradingView
Day traders may prefer to reduce the SMA duration to 10 periods (or even less). This will make the indicators respond quicker to market trends and shifts in price action. In contrast, longer-term investors and swing traders might want to increase the time to 50.
Tip
Shorter durations will present traders with more opportunities, but also more false flags. Greater SMA periods will reveal fewer, but more reliable, trade signals.
The number of standard deviations used for each Bollinger Band is automatically set to 2. This figure can be adjusted positively or negatively. Lowering the standard deviation to between 1 and 1.9 will result in a less reliable reading than a standard deviation of 2, but is more responsive to price movements. A higher standard deviation will make trends appear much slower but more accurately.
Good indicators to use with Bollinger Bands
Like every indicator, Bollinger Bands are not a foolproof mechanism and can provide traders with false trend signals. This is why investors often combine Bollinger Bands with other technical analysis tools to ensure there is less chance of a false signal. A popular trading strategy is to combine the Bollinger Bands, RSI, Stochastic, and MACD indicators.
Relative Strength Index (RSI)
Bollinger Bands are based on the Relative Strength Index (RSI) and provide similar information to an RSI analysis. Both indicators suggest whether an asset is overbought or oversold and are relatively simple to understand. It is a good idea to confirm trends read with Bollinger Bands by comparing them to an RSI to mitigate the risk of false signals.
For example, if an asset’s price hits a lower Bollinger Band and the RSI is oversold (under 30), both indicators are in agreement, and this is likely a good entry point. However, if the RSI instead indicates the asset is overbought, the indicators would be conflicting, and traders may wish to stay away.
Stochastics indicator
A stochastics indicator is a analysis tool that compares the current price of an instrument to a variety of its prices over a specific duration. It is a momentum indicator that utilises support and resistance levels to determine if an asset is oversold or overbought. Stochastics indicators can be a useful way to confirm price trends observed in Bollinger Bands.
MACD
The Moving Average Convergence Divergence (MACD) is another momentum indicator used to determine the strength of existing price trends. It is often used in conjunction with Bollinger Bands to assess whether a trend is slowing down or preparing for a breakout. Once this has been established, Bollinger Bands can be applied to find a suitable entry point for traders.
Important To Remember
Bollinger Bands are most effectively used when combined with other indicators. This can help traders avoid false signals and confirm momentum shifts or price trends.
Bollinger Bands trading strategies
Bollinger Bands can be a powerful tool for traders to determine price trends, entry/exit points or shifts in momentum. These strategies are popular among both beginner and advanced investors due to their simplicity and integration with other financial tools.
Riding the bands
Riding the bands refers to selling an asset if its price breaks the upper Bollinger band, or buying if it drops below the lower band (Figure 3). An easy way of implementing this technique is to purchase an instrument as it falls below the lower Bollinger Band, then try to exit as the price moves to the upper band. When paired with momentum indicators, this can be an excellent way of analysing market volatility and price trends.
When using this trading strategy, it is vital to wait for confirmation of a trend reversal. For example, if the wick of a candle breaches the upper band, an experienced trader will wait for one or two candle closes below the breakout candle, to confirm a momentum shift. If traders do sell before confirmation, they could miss out on a run where the price candles hug the upper band, and an asset continues to rise in value.
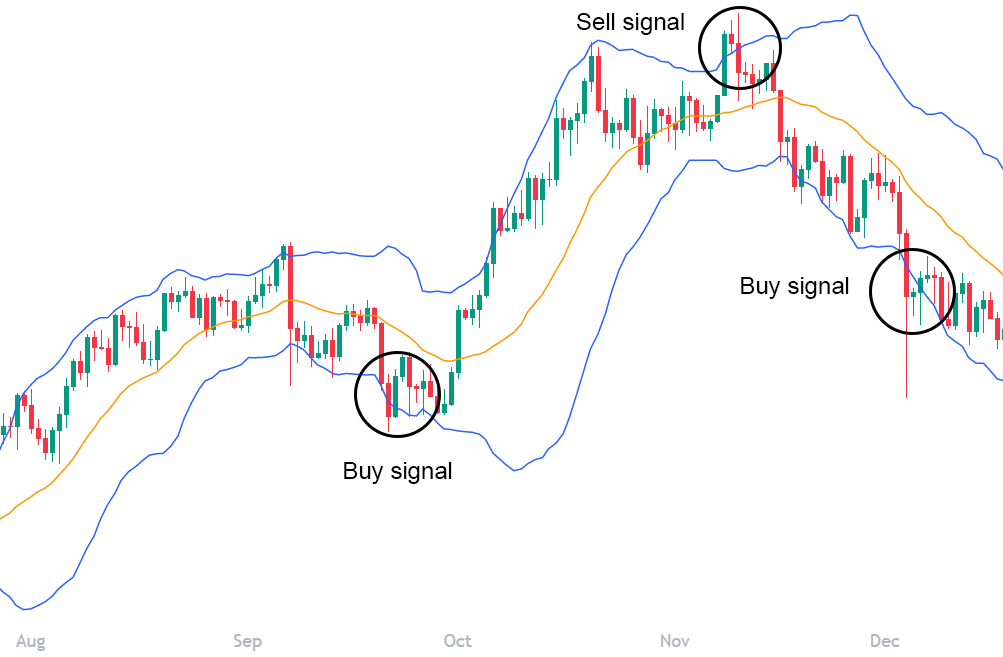
Figure 3 – Some signals generated by “riding the bands”
It’s important to note that often during an uptrend, the middle line (SMA) will act as a rising support line or entry point. When there is a downtrend the SMA often acts as a rising resistance line or exit point.
However, riding the bands is a flawed strategy on its own and should not be viewed as a sole trading signal. This is because major price trends can occur entirely within the two bands during strong market downturns or upswings. Price action that breaks out of the top band may correct in the short term but provides little information on longer-term price movement.
Bollinger Band squeeze
The “squeeze” is one of the most prominent strategies used in conjunction with Bollinger Bands. This concept revolves around volatility. When the upper and lower bands converge, it is called the squeeze. The squeeze indicates low volatility in the market and is a sign that a period of high volatility may be incoming (Figure 4). This can give traders ample trading opportunities due to the large price movements associated with higher volatility.
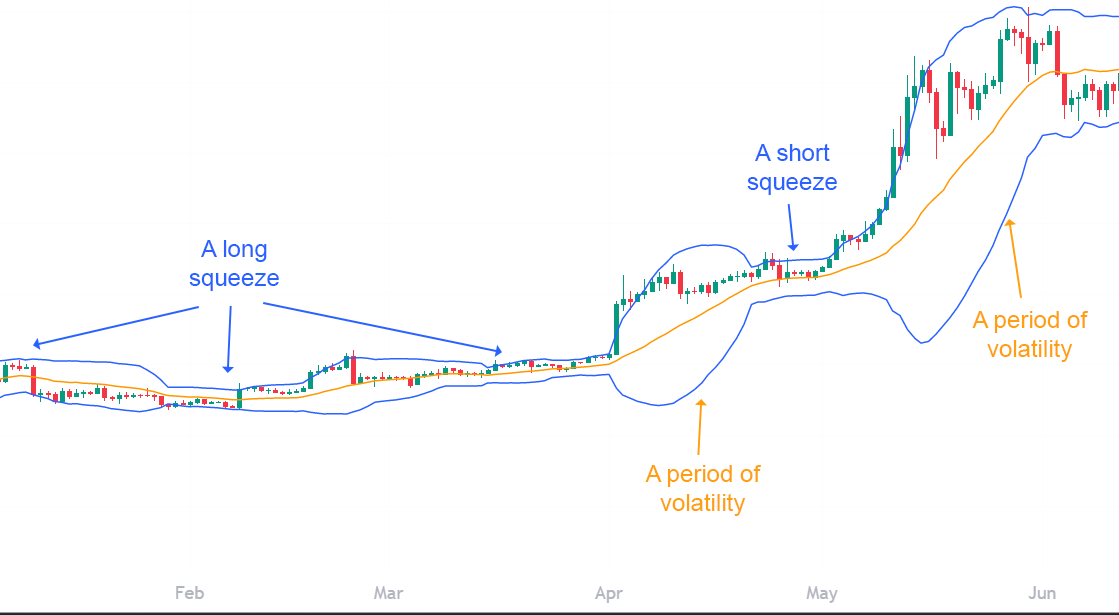
Figure 4 – The cycle of squeeze and volatility
While monitoring the squeeze can be a good strategy, it doesn’t help determine in which direction or how long a price trend will go.
Did You Know?
John Bollinger himself created a list of 22 Bollinger Band rules for traders wanting to get the most out of his analysis tool. These were made in response to FAQs from investors through his 30 years of trading experience.
What are the limitations of Bollinger Bands?
The primary issue with Bollinger Bands is that traders should never use them in isolation. They are intended to help investors determine volatility levels and to predict short-term shifts in momentum. However, Bollinger Bands are most reliable when paired with other TA techniques that use different data sets, such as RSI, MACD and Stochastic indicators.
It’s also worth considering that the SMA (middle line) is based on historical data. This can make some trends observed from Bollinger Bands a little noisy, as older, less relevant price data may be influencing the analysis.
Summary
Bollinger Bands are an important technical analysis indicator for traders of any skill level to learn. They are a good method of assessing market volatility, and when paired with other trading tools, can help traders find suitable entry and exit points. However, they are not foolproof and don’t always provide information on the direction of future price movements. Newcomers to trading should not rely on any one analysis tool while investing and ensure they understand the associated risks.
Disclaimer: The information on Swyftx Learn is for general educational purposes only and should not be taken as investment advice, personal recommendation, or an offer of, or solicitation to, buy or sell any assets. It has been prepared without regard to any particular investment objectives or financial situation and does not purport to cover any legal or regulatory requirements. Customers are encouraged to do their own independent research and seek professional advice. Swyftx makes no representation and assumes no liability as to the accuracy or completeness of the content. Any references to past performance are not, and should not be taken as a reliable indicator of future results. Make sure you understand the risks involved in trading before committing any capital. Never risk more than you are prepared to lose. Consider our Terms of Use and Risk Disclosure Statement for more details.