TradingView is a powerful charting and technical analysis platform that integrates social and collaborative functions. Here’s what you need to know to get started on TradingView. Using TradingView, it’s possible to monitor price charts and perform technical analysis (TA) for thousands of different assets like stocks and cryptocurrencies. This guide will take you through the layout and features of TradingView and show you how to use some popular tools and indicators!
TradingView basics
TradingView combines a broad spectrum of charting tools, technical indicators, real-time data and charts, and social networking features that allow users to share and discuss ideas and market insight. The TradingView charting platform can be accessed via your Swyftx account, a web interface, a dedicated desktop app, or apps for both iOS and Android devices.
If you’re new to technical analysis, the tools and charts presented via TradingView can appear intimidating. Getting started with TradingView doesn’t have to be complicated, however. The TradingView environment is designed to assist both new traders and experts with the resources and chart tools they need to make informed crypto trading or investment decisions. We recommend learning how to read a candlestick chart before you start using TradingView.
What can you do with TradingView?
TradingView allows users to create and customise technical indicators in order to analyse cryptocurrencies or a wide range of other assets. Customisation is the most important feature of TradingView — users are able to perform virtually any kind of technical analysis by either using community-created TA tools or creating their own indicators.
TradingView users can create and share charts and technical analysis insights with each using a variety of social elements. For instance, when a user views a chart for a specific cryptocurrency, TradingView provides a streamlined news feed along with public chat rooms focused on the asset. TradingView’s social media-like features allow users to share charts, commentaries, or videos with the TradingView community, facilitating collaborative analysis and encouraging peer-to-peer feedback.
Important to Remember
The information published or shared by other users on TradingView is speculative in nature. While these ideas are a great starting point for your research, you should always be cautious basing your investment decisions on other people’s speculation.
TradingView and Swyftx
Swyftx provides users with built-in TradingView functionality (Figure 1), which makes it possible to create charts, perform technical analysis, and trade at the same time. The features and tools available through Swyftx’s TradingView integration are similar to those available on the TradingView website and work the same way.

Figure 1 – TradingView on Swyftx trading platform
Getting started: the TradingView user interface and charts
TradingView charts for any given asset provide users with an overview of price performance and volume over a specific time period — users are able to alter the timescale of a chart anywhere from one second to five years.

Figure 2 – BTC-USDT trading pair
Charts, by default, present the open, high, low, and close, (OHLC) for candlesticks within a timescale, in addition to spread value, bid and ask prices, and a countdown that indicates the next chart update.
TradingView tools
When viewing a chart on TradingView, you’ll observe four separate toolbars on the top left, top side left, side right, and bottom left sides of the user interface.

Figure 3 – TradingView toolbars
The top left toolbar allows users to switch between chart types, from candle to line, or access a range of overlays. The “indicators” section of the top left toolbar provides users with a selection of indicator scripts that can be inserted from built-in indicators, candlestick patterns, or loaded from a public library of indicators and strategies created by users. It’s also possible for advanced users to create their own scripts using Pine Script, TradingView’s native scripting language.
The left-side toolbar provides access to a selection of technical indicators (Figure 3). These indicators can be plotted on the chart, and range from trend lines or simple moving averages to complex Fibonacci retracements. In addition to providing technical analysis indicators, the top side left toolbar provides tools for marking a chart, such as icons and highlighters.
The right-side trading panel provides access to social tools, such as news headlines relevant to the asset currently being viewed, personalized watchlists, alert functions, streams and ideas, and both public and private chat rooms (Figure 3).
Lastly, the bottom trading panel of the chart interface provides trading tools, including a paper trading function that allows users to simulate trades. Other tools available from the bottom toolbar include a Pine Script editor, text note function, and a strategy tester.
How to customize your TradingView charts
It’s possible to customise the appearance and layout of your chart via the settings cog icon at the top right of the chart interface (Figure 4). Alternatively, appearance and layout can be edited by right-clicking anywhere on the chart to access settings via a context menu. There is also a range of custom indicators available.

The settings menu is divided into six categories:
- Symbol can be used to alter the appearance of the chart, such as changing colors, default time zone, or adding or removing price lines
- Status line allows users to change OHCL data, indicator titles, and background opacity
- Scales provides options for price data details
- Appearance allows users to customize the background to the price chart and other visual elements such as margins and navigation buttons
- Trading can be used to alter the way users trade on the TradingView platform
- Events is used to hide or display data such as dividends, splits, and earnings.
In addition to altering appearance and layout, it’s also possible to alter the intervals of candlesticks. Interval settings can be found in the top left of the user interface — click the interval timescale to access a drop-down menu that ranges between seconds and months.
How to set up and draw trend lines
Once you are familiar with the TradingView user interface and customization options, you’re ready to start charting. If you’re new to charting, a simple trend line is one of the easiest and simplest methods of analysing price movements and is one of the most frequently used chart patterns. To create a trend line, click the Trend Line tool from the left-side toolbar (Figure 5).
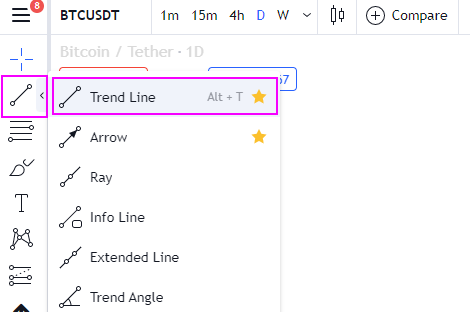
Figure 5 – TradingView trend lines
To chart an uptrend, you’ll need to begin your line at a local low point prior to a price rise — typically referred to as a swing low (Figure 6). Select where you’d like to begin your trend line and include as many lows as possible. When you’re ready to complete your trend line, click again.
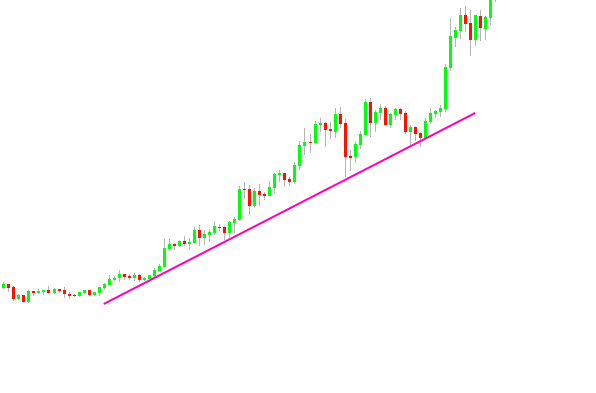
Figure 6 – Trend line drawn on the chart
Once you’ve created your trend line, it’s possible to double-click it to bring up a settings menu that provides customisation options for shape, color, text, and visibility.
Did You Know?
When drawing trend lines, you should try to either connect the extremities of the candle bodies or the end of the candle wicks together.
How to set up a pitchfork
A pitchfork is a more complex chart that consists of three parallel trend lines. Used to identify possible support and resistance levels or breakout and breakdown levels, a pitchfork is a three-point indicator and provides more insight than a standard trend line, but involves a few additional steps.
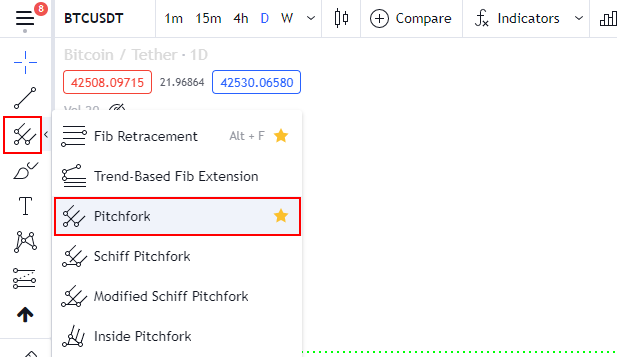
Figure 7 – Pitchfork tool on TradingView
To create a pitchfork, select the Pitchfork tool from the left-side toolbar. Place the first point of the pitchfork at the beginning of an uptrend or downtrend, then place the second point at the reaction-high point of your trend. Lastly, place the third and final point at the reaction-low point of your trend (Figure 8).

Figure 8 – Pitchfork tool applied to a chart
The resulting indicator is a pitchfork-like shape that provides insight into resistance and support levels, as well as the general direction of a trend. The top line that extends from point two indicates the resistance line, while the bottom line that extends from point 3 indicates the support line. In most cases, the price of the asset can be expected to gravitate towards the median line.
Setting up TA indicators
There are various technical indicators that traders can use that leverage technical analysis to get insights on price trends and market movements. Commonly used examples of TA indicators include relative strength index (RSI), Bollinger Bands, and moving averages (simple moving average and exponential moving average). You can implement these indicators into the chart you are viewing by searching for your desired indicator via the search bar (Figure 9).

Figure 9 – Relative Strength Index Indicator
How much does TradingView cost?
TradingView is free to use via your Swyftx account or via the TradingView platform. There are, however, a few restrictions on the total number of charts or indicators that can be viewed simultaneously via the free TradingView service.
TradingView offers a number of monthly subscription options for users seeking more advanced tools. This includes Pro, Pro+, and Premium TradingView accounts offering additional indicators, multiple device support, custom formulas, data export tools, and additional technical analysis functionality.
Summary
TradingView is a highly configurable platform that provides simple charting functionality for relatively new traders alongside advanced charting and drawing tools for experts and professional traders. The social elements of the TradingView platform provide users with a wide range of resources that assist in developing trading strategies and analysis skills. Learn more about technical analysis and a range of other exciting topics related to cryptocurrency and trading on Swyftx Learn.
Next lesson

Disclaimer: The information on Swyftx Learn is for general educational purposes only and should not be taken as investment advice, personal recommendation, or an offer of, or solicitation to, buy or sell any assets. It has been prepared without regard to any particular investment objectives or financial situation and does not purport to cover any legal or regulatory requirements. Customers are encouraged to do their own independent research and seek professional advice. Swyftx makes no representation and assumes no liability as to the accuracy or completeness of the content. Any references to past performance are not, and should not be taken as a reliable indicator of future results. Make sure you understand the risks involved in trading before committing any capital. Never risk more than you are prepared to lose. Consider our Terms of Use and Risk Disclosure Statement for more details.
 Article read

- TradingView basics
- What can you do with TradingView?
- TradingView and Swyftx
- Getting started: the TradingView user interface and charts
- TradingView tools
- How to customize your TradingView charts
- How to set up and draw trend lines
- How to set up a pitchfork
- Setting up TA indicators
- How much does TradingView cost?
- Summary