In the world of crypto trading, technical analysis (TA) is one of the various methods traders can use to attempt to predict which way the market is moving. By analysing chart patterns and using indicators, traders can gain a deeper insight into the market. The Relative Strength Index (RSI) is a popular indicator that has been used in traditional markets for decades and has been adapted for crypto in recent years.
This guide aims to explore what the RSI is, what the indicator can show traders, how to interpret it, and its limitations.
What is the Relative Strength Index (RSI)?
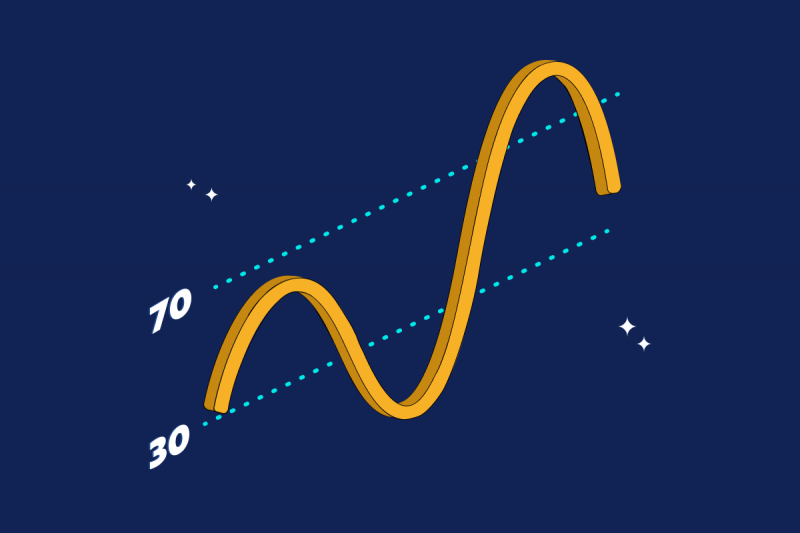
The Relative Strength Index (RSI) is a popular indicator used for technical analysis (TA). It was developed by J. Welles Wilder Jr. and was introduced in his landmark book New Concepts in Technical Trading Systems in 1978. Put simply, the RSI gives a score between 0 and 100. When the score is below 30 that generally indicates that a stock is oversold. A score above 70 indicates that a stock is in overbought territory.
The RSI measures the average percentage loss and gain to determine the general trend of an asset. By using this information, traders try to determine possible entry and exit points based on bullish and bearish price momentum. Over the years the RSI indicator has remained relevant and is seen as one of the core tools used by cryptocurrency technical analysis traders all over the world.
Tip
Technical indicators are divided into two main categories, leading and lagging indicators. A leading indicator, like the RSI, tries to predict the future by giving a signal before the trend occurs – therefore leading the trend. On the other side of the coin, lagging indicators use historic data and trail price action – therefore lagging behind the trend – confirming the strength of a trend.
Why is the RSI important?
The RSI provides a visual means to monitor both the current, as well as historical, strengths and weaknesses of a particular asset. Based on closing prices the indicator displays the strength or weakness of the chosen period to create a metric of momentum changes. These are plotted on a scale between 0 and 100, where 0 is the weakest and 100 is the strongest.
Calculating the RSI faithfully requires highly technical knowledge and complex explanations beyond the scope of this guide. However, a simplified version exists to calculate RSI, which is: RSI = 100 – [100 / (1 + (Average of Upward Price Change / Average of Downward Price Change)].
Generally, traders will have the RSI under the chart in order to compare momentum against price action. Figure 1 below shows where the RSI can be found on a crypto TradingView chart. Frequently used by swing traders, the RSI can be used to look for signals of increasing or decreasing momentum in the short and medium-term price movements. It can also be used for spotting trend changes and opening positions on trend reversals.
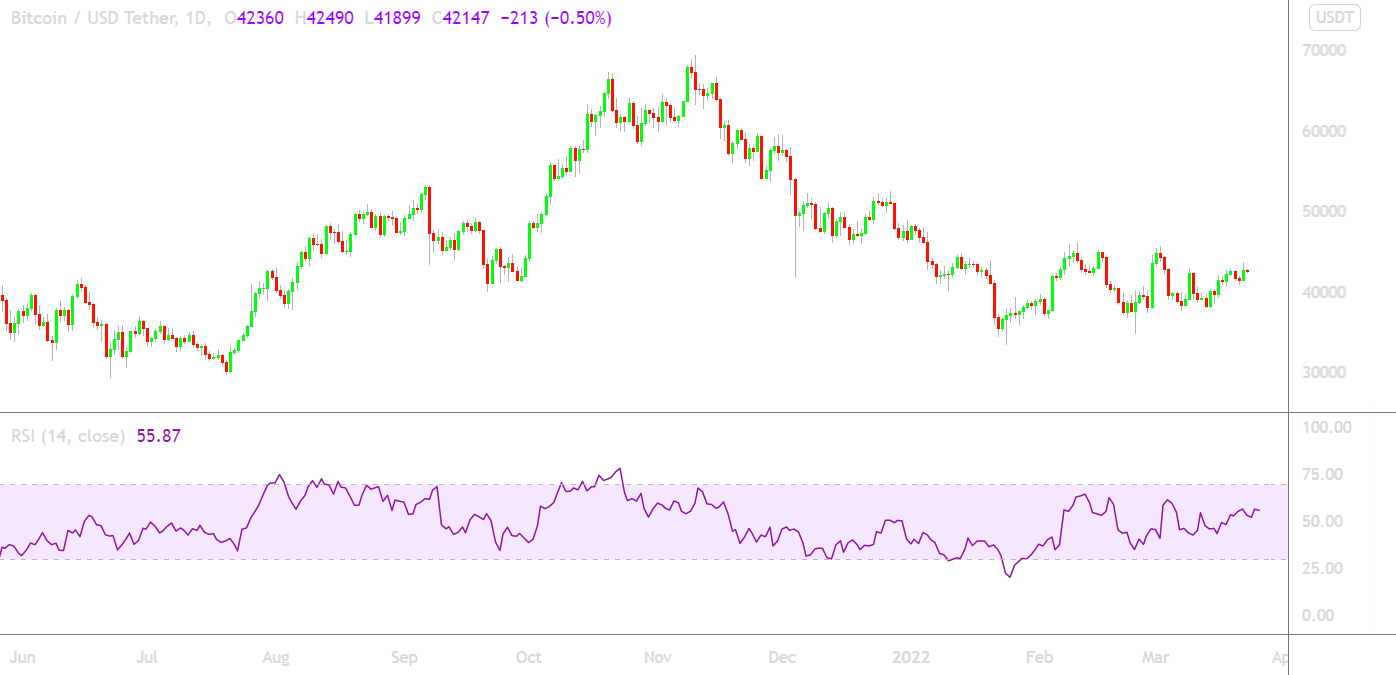
Figure 1 – The RSI appears at the bottom of most TradingView charts
Did You Know?
The RSI is a type of indicator known as an oscillator. An oscillator creates high and low bands between two values, and then produces a value that “oscillates” between these limits. This type of indicator works best in volatile markets, which makes the RSI a useful tool for the crypto market, moving dynamically between bullish and bearish.
Interpreting RSI indicators
The RSI indicator is generally displayed as an oscillator between the limits of 0 – 100, with the values being representative of the average percentage gain or loss over a 14-day period. Oscillators fluctuate between two limits, above and below a midpoint and their value helps to gauge the strength and momentum of a trend.
The closer RSI value is to 0, the weaker the momentum is for price movements, conversely the closer to 100 the stronger the price movement. The RSI generates an overbought signal when above 70 and an oversold signal when below 30.
When the RSI makes higher highs and breaks through the 30 zone to the upside the asset is starting an uptrend. This could continue until it hits the 70 zone where it becomes overbought, and traders should then look for a possible trend reversal. The oscillator indicates a trend and traders should look for long and short positions when crossing over the zones.
Tip
RSI limits can be customised to enhance signals depending on the current trend. The difference between bull and bear markets affects how the RSI behaves. When in a bull market, RSI values can be moved to the 40 to 90 range, with the 40-50 range seen as support. In a bear market, the reading on the RSI typically stays within the 10 to 60 range, with the 50-60 zone signalling resistance. These ranges are typical but may vary based on RSI settings and the strength of the underlying market trend.
RSI divergences
A divergence occurs when the RSI moves in the opposite direction to the price chart. This phenomenon is seen as a signal that the current price trend may be weakening, and in some cases may lead to the price changing direction. By comparing price movement to the RSI’s oscillator, divergence can be spotted. If the asset’s price rises and makes new highs, normally the RSI is reaching new highs as well. If the asset is making new highs, but the RSI starts making lower highs, this could be indicative of divergence and alerts the price uptrend may be weakening.
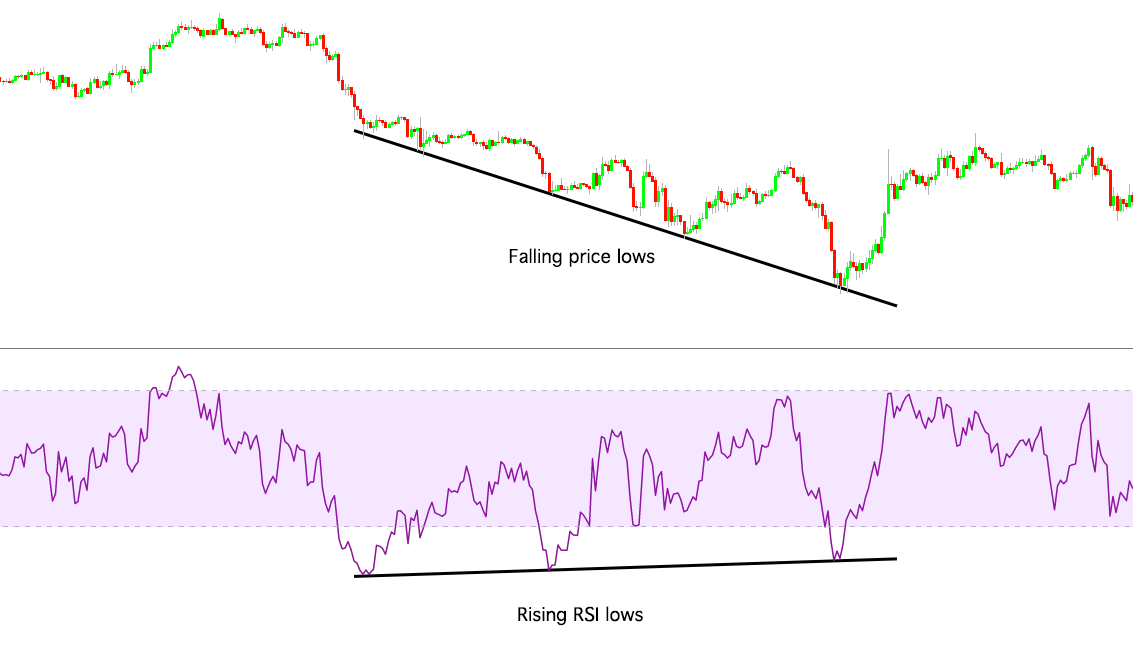
Bullish divergence
Bullish divergence can be seen when the price reaches lower lows, but the RSI is making higher highs. This indicates rising bullish momentum, and a break above oversold territory could be used as a signal to enter a long position in anticipation of a bullish trend.
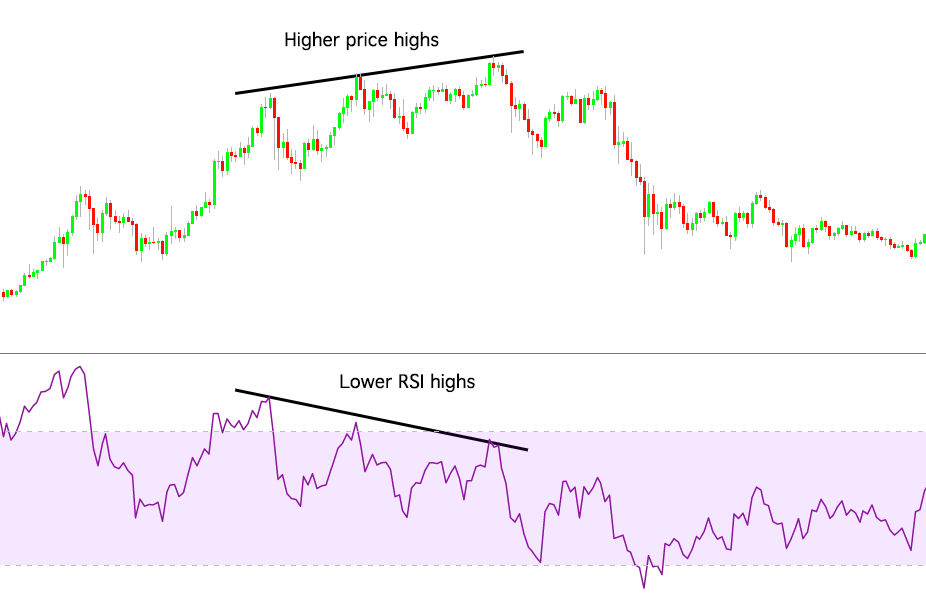
Bearish divergence
Conversely, A bearish divergence occurs when the price makes higher highs, but the RSI is making lower lows, a breakout of the overbought level could signal a short position, with the expectation that a bearish trend will follow.
RSI failure swings
Trend signals that suggest a reversal are known as failure swings. These swings can occur during uptrends or downtrends, where the former refers to selling activity and the latter indicates buying activity. A failure swing arises when the index oscillator does not follow the high point (of the asset price) in an uptrend or the low point in a downtrend.
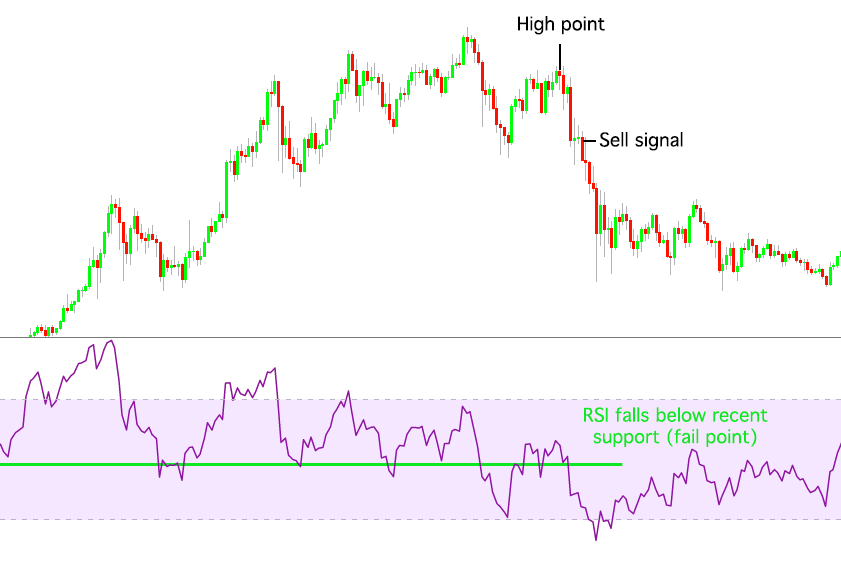
Failure swing top
A failure swing top takes place when an asset’s price reaches a high point, but the RSI drops below the recent support (fail point), triggering a sell signal.
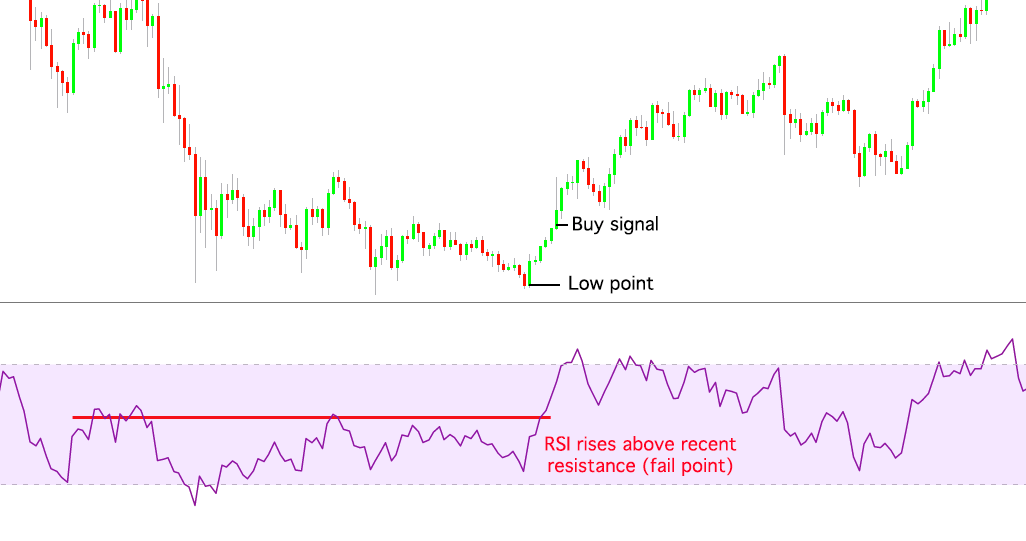
Failure swing bottom
A failure swing bottom happens when an asset’s price hits a low point, but the RSI jumps above the most recent resistance (fail point), triggering a buy signal.
RSI vs MACD
The relative strength index (RSI) and the Moving Average Convergence Divergence (MACD) are both momentum indicators that can help determine overbought and oversold levels. The main difference is that the MACD measures the relationship between two exponential moving averages (EMAs), whereas the RSI measures prices changes in regard to recent highs and lows. The RSI and MACD are often used in conjunction to provide a more complete picture of market conditions.
Limitations of the RSI
The RSI, like most indicators, is most reliable when conforming to the long-term trend. Accurate reversal signals aren’t always that easy to spot and could be misinterpreted as false signals. For example, if the RSI dips below 70 with no divergence and the price continues to increase. Additionally, if the asset has strong momentum in either direction it can stay in the overbought or oversold range for a long time after the trend has already reversed.
Important To Remember
Indicators are not all-encompassing, each of them has a specific function and can’t be used to determine everything. For this reason, almost all traders combine different indicators to get a better understanding of price movement. Most experienced traders don’t make trades based on just the RSI or any single indicator by itself. Expert traders use various indicators in conjunction with each other to find better signals to enter or exit a market.
Wrap up
The RSI is a powerful indicator that has withstood the test of time for traders in both traditional and crypto markets. The indicator can provide valuable information about when an asset has reached a condition where it becomes likely for the trend to change or just to monitor the trend in general. This can help traders find as well as get out of positions based on the information provided by the indicator.
While the RSI crypto indicator does deliver interesting and actionable information, it should not be used just on its own. Including the RSI into a trader’s arsenal of skills and indicators can help them spot weakening trends through divergence and failure swings to stay out of trades that look too risky.
Disclaimer: The information on Swyftx Learn is for general educational purposes only and should not be taken as investment advice, personal recommendation, or an offer of, or solicitation to, buy or sell any assets. It has been prepared without regard to any particular investment objectives or financial situation and does not purport to cover any legal or regulatory requirements. Customers are encouraged to do their own independent research and seek professional advice. Swyftx makes no representation and assumes no liability as to the accuracy or completeness of the content. Any references to past performance are not, and should not be taken as a reliable indicator of future results. Make sure you understand the risks involved in trading before committing any capital. Never risk more than you are prepared to lose. Consider our Terms of Use and Risk Disclosure Statement for more details.