If you regularly observe the crypto market, it’s likely that you have heard of the Fear and Greed index. The Fear and Greed Index is a metric that provides a score ranging from 1 to 100 that indicates the general sentiment of the crypto market and stock market at any given time. This index can be useful for traders and investors trying to determine when to enter or exit the market.
This article will break down the structure of the cryptocurrency Fear and Greed Index and highlight the key indicators it uses to gauge sentiment.
What are market indicators?
Indicators are key factors used to quantify market information and measure current conditions. The crypto Fear and Greed Index combines a variety of metrics in order to provide insight into the digital asset market. It’s important to understand how the index is structured, and how its indicators function.
Indicators can range from simple technical indicators such as simple moving averages to complex chart patterns such as Ichimoku clouds. While there are many different types of indicators to use when analysing digital asset markets, no one indicator is better than another — each indicator performs a specific function that, when combined with a robust analysis strategy, can provide deep insight into market movements.
There are a number of different ways to analyse digital asset markets using indicators, which can be broadly divided into technical analysis, fundamental analysis, and market sentiment.
Technical analysis indicators
Technical analysis is primarily concerned with data-driven analysis of crypto markets in order to gain insight into market movements and identify potential trends. Technical analysis typically considers factors such as price data and volume in order to track and anticipate trends.
Some technical analysis indicators include moving averages, relative strength index (RSI), moving average convergence divergence (MACD), and other statistical analyses of crypto market behaviour. Technical analysis is generally driven by statistical analysis and, in most cases, projected onto asset price charts.
Fundamental analysis indicators
Fundamental analysis is primarily concerned with establishing the “real” value of a digital asset. It does this by identifying and confirming all available information about an asset except for market price and volume data.
Fundamental analysis metrics can include on-chain data such as transaction count, transaction value, hash rate, and active addresses, or project metrics such as the team behind a project, partnerships, market capitalization, and tokenomics.
Key fundamental analysis indicators and metrics can include network value to transactions ratio (NVT), market value to realised value ratio (MVRV), and stock-to-flow model.
Market sentiment
Market sentiment is basically crowd psychology applied to the behaviour of market participants. Sentiment is generally measured by observing the actions of crypto investors and how they interact with both the market and one another.
The Fear and Greed Index itself is an indicator that measures market sentiment, but combines technical and fundamental indicators with multiple market sentiment indicators to create a broad sentiment analysis.
Key Takeaway
There are many different ways to identify trends and patterns in crypto markets. The Fear and Greed Index uses fundamental, technical, and sentiment metrics to analyse the digital asset market.
What is the Fear and Greed Index?
The Alternative.me crypto Fear and Greed Index (Figure 1) is currently the most widely used within the digital asset market.
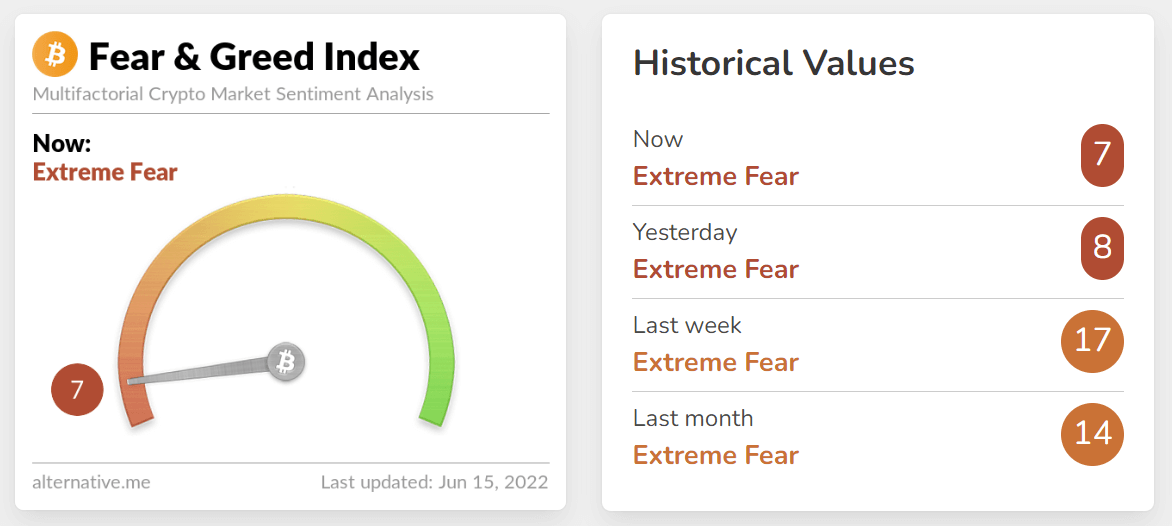
Figure 1 – The Alternative.me Crypto Fear and Greed Index
This index is based on the CNNMoney Fear and Greed Index, which was originally created to measure market sentiment in traditional asset markets. Both indexes reflect Warren Buffet’s widely-cited quote: “Be fearful when others are greedy, and greedy when others are fearful”.
The crypto Fear and Greed Index updates every 24 hours and provides information on the current index, as well as the previous day, an average of the last week’s index values, and an average of the last month’s index values (as shown in the image above).
The Fear and Greed Index currently only measures market data associated with Bitcoin, rather than indicators and data on the entire crypto market. This is because Bitcoin fear or greed has a significant correlation with the entire digital asset market, with major Bitcoin price movements typically reflected in the market at large.
How is the Fear and Greed Index calculated?
By analysing multiple indicators, the crypto Fear and Greed Index provides a metric of between 1 and 100. The crypto Fear and Greed Index is interpreted as follows:
- A score of 1-24 represents extreme fear
- A score of 25-49 is an indicator of moderate fear
- A score of 50 signifies a neutral market
- A score of 51-74 indicates moderate greed
- A score of 75-100 represents extreme greed
An extremely low number indicates that the market is currently in a state of extreme fear, in which market participants are selling due to a loss of confidence in asset values. A fearful market could potentially indicate that the crypto market is undervalued, as excessive fear within a market can lead to panic and overselling. This could represent a buying opportunity.
Important To Remember
Fear present in a market doesn’t necessarily indicate a long-term bearish trend — the Fear and Greed Index generally provides insight into short to medium-term market sentiment.
Inversely, an extremely high score indicates that the market is currently in an extreme state of greed, indicating that market participants are buying and potentially overvaluing assets. Greed present within a digital asset market can indicate overvaluation and potential market bubbles. In some high greed scenarios, for example, investors may drive demand and artificially inflate asset prices.
What does the Fear and Greed Index measure?
The crypto Fear and Greed Index is calculated using multiple market factors with different weights (Figure 2). These factors are broken down further, beneath the image.
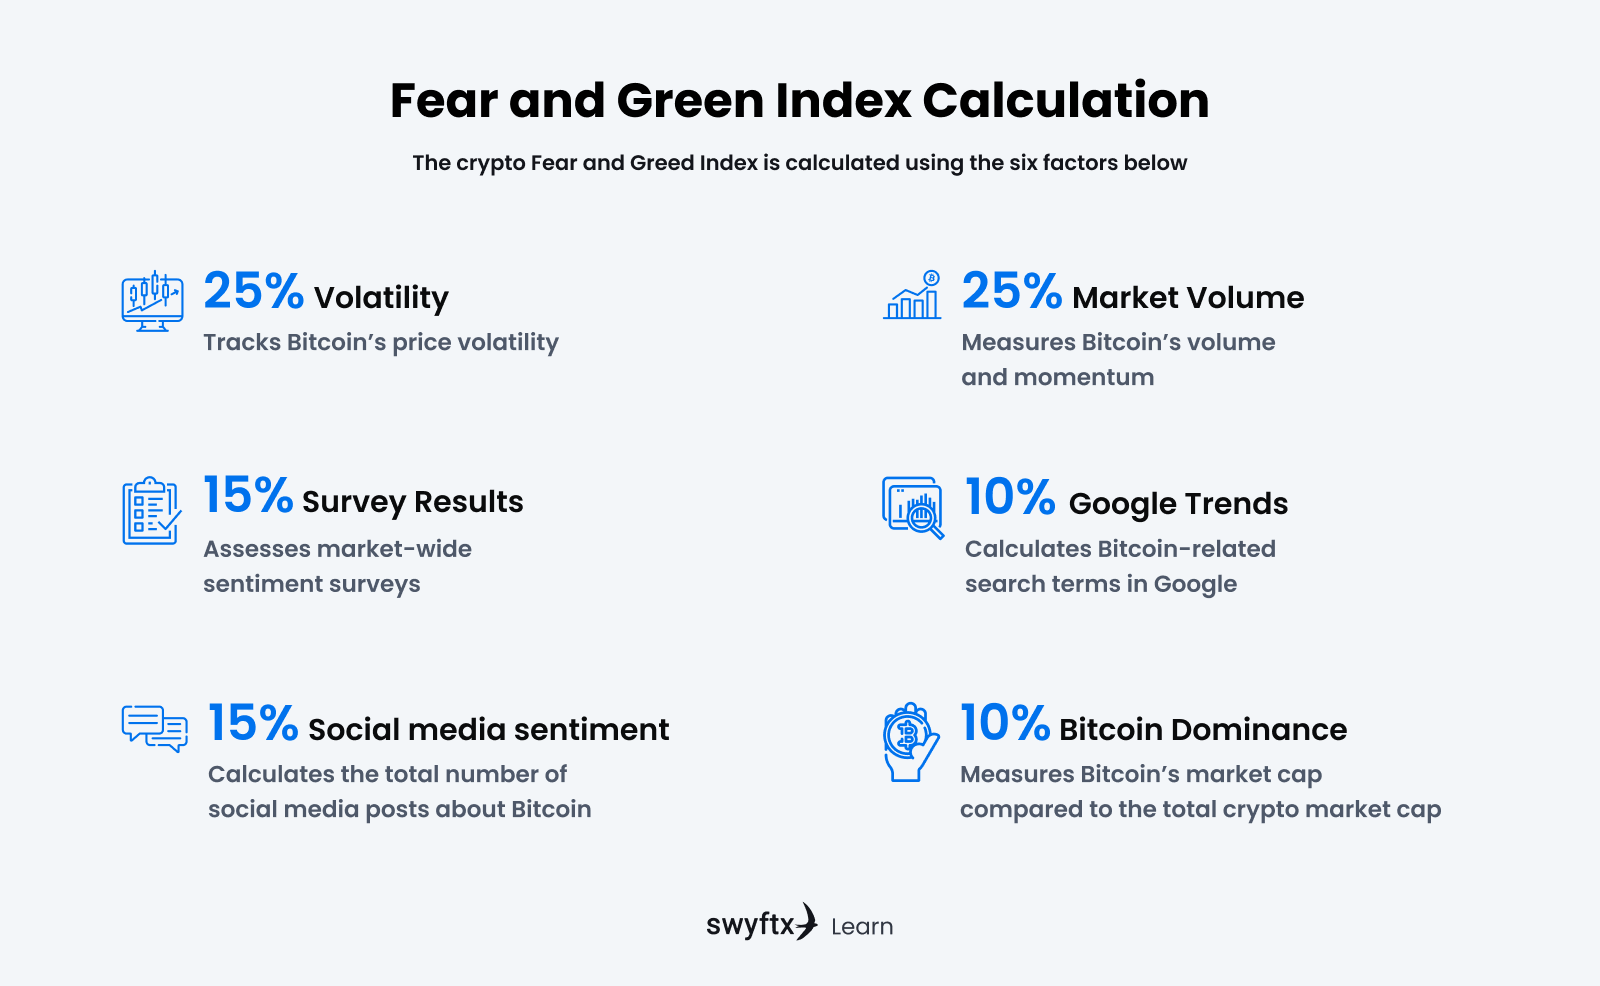
Figure 2 – Factors used to calculate the Fear and Greed Index
Volatility
The Fear and Greed Index compares the 30 and 90-day market volatility of Bitcoin against volatility and drawdowns (decline in value). A higher degree of volatility is associated with fear. Volatility accounts for 25% of the index.
Market volume
The index measures the volume and momentum of the Bitcoin market against both 30 and 90-day averages. High volume and momentum represent negative metrics and increase the index value, indicating greedy market sentiment. Market momentum and volume account for 25% of the index.
Social media sentiment
By quantifying the total number of social media posts (such as Facebook posts or Tweets) made regarding Bitcoin and average engagement rates, the index compares collected data to historical averages. High social media interactions are associated with greed. Social media accounts for 15% of the Fear and Greed Index.
Survey results
The Fear and Greed Index conducts market-wide surveys on a weekly basis, with each survey typically engaging 2,000 to 3,000 respondents. Positive or enthusiastic survey responses are associated with greedy market behaviour. The survey element is intermittently paused, but when active represents 15% of the index.
Bitcoin dominance
In general terms, lower Bitcoin dominance indicates that investors are directing attention towards altcoins, indicating market greed. Bitcoin dominance measures the market capitalization of Bitcoin compared to the overall market cap of the entire crypto market. It accounts for 10% of the Fear and Greed Index.
Google trends
The Fear and Greed Index will pull Google Trends data regarding the frequency and intensity of Bitcoin-related search terms. While higher search interest is typically associated with greed, a high number of negatively correlated search terms can indicate the presence of fear in the market. Trends account for 10% of the index.
Is the Fear and Greed Index a good trading indicator?
The Fear and Greed Index can be an effective tool for measuring digital asset market trends at a glance. Historical Bitcoin price movements, when compared to historical Fear and Greed Index data, is generally closely correlated (see Figure 3). Higher Bitcoin prices are typically associated with higher index values.
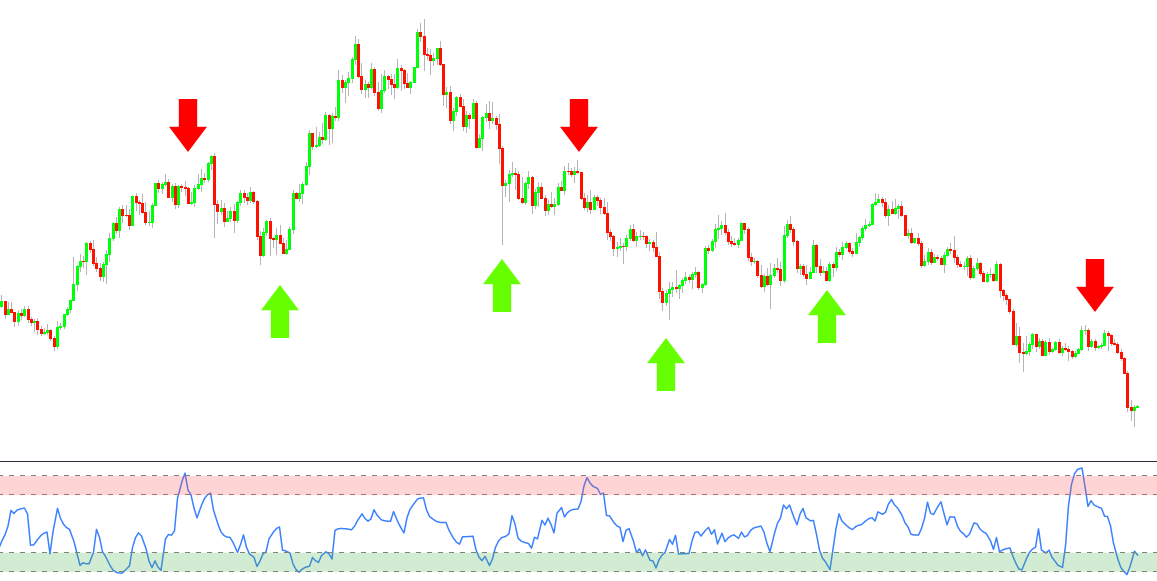
As the figure above shows, when the Fear and Greed Index at the bottom is in the red band this indicates extreme greed (75-100), which is generally followed by a severe decrease in the price of Bitcoin, signified by the red arrows. Conversely, when the index is in the green band, that signifies extreme fear (1-24), which is often followed by a spike in price, as shown above with the green arrows.
Is the Fear and Greed Index right for me?
Determining whether the Fear and Greed Index is useful to you depends on a number of factors. The index itself is not infallible — both traditional and digital asset markets are unpredictable and often exhibit behaviour contrary to technical or fundamental analysis.
In some cases, large market swings may be anticipated by extremely high or low Fear and Greed Index values, which can potentially provide traders with the ability to enter or exit the market before the rest of the market follows the trend. Using the Fear and Greed Index as a way to verify predictions can assist in confirming patterns a trader may identify through other analyses.
It’s important to remember that the Fear and Greed Index is not a strong indicator of long-term digital asset market sentiment and provides information only on short-term trends and patterns. Bull and bear markets both exhibit swings of fear and greed. Understanding Bitcoin and crypto market cycles can help traders make informed decisions when using the index.
Tip
The Fear and Greed Index provides information on short-term market sentiment, but should always be combined with additional analysis or technical indicators.
Summary
The Fear and Greed Index is a simple tool that can be used to observe the current sentiment of the crypto market at a glance. By integrating multiple factors like market volume, social media sentiment, volatility, survey results, Bitcoin dominance, and Google Trends, the Fear and Greed Index provides valuable insight into whether the market is currently fearful or greedy.
While the Fear and Greed Index can provide general information on the state of the digital asset market, it’s best to use it in combination with other metrics, technical indicators, or additional research in order to develop a coherent, balanced view.
Disclaimer: The information on Swyftx Learn is for general educational purposes only and should not be taken as investment advice, personal recommendation, or an offer of, or solicitation to, buy or sell any assets. It has been prepared without regard to any particular investment objectives or financial situation and does not purport to cover any legal or regulatory requirements. Customers are encouraged to do their own independent research and seek professional advice. Swyftx makes no representation and assumes no liability as to the accuracy or completeness of the content. Any references to past performance are not, and should not be taken as a reliable indicator of future results. Make sure you understand the risks involved in trading before committing any capital. Never risk more than you are prepared to lose. Consider our Terms of Use and Risk Disclosure Statement for more details.