
Technical analysis indicators consist of patterns and signals that can provide traders valuable insight and help them make informed trading decisions. Golden and death crosses are well-recognised chart patterns that help identify long-term trend reversals. This article will unpack what a golden and death cross is, how to recognise them, and some things to consider when using these signals.
The basics of technical analysis and moving averages
Golden and death crosses are chart patterns used in technical analysis that utilise moving averages. At first glance, the market seems to move randomly. Technical analysis uses indicators and chart patterns to identify market trends and allow traders to make predictions on market movements.
Moving averages are a popular technical analysis tool that is used to determine the direction of a trend. A moving average smooths out price data by using the average price over a set period.
What is a golden cross?
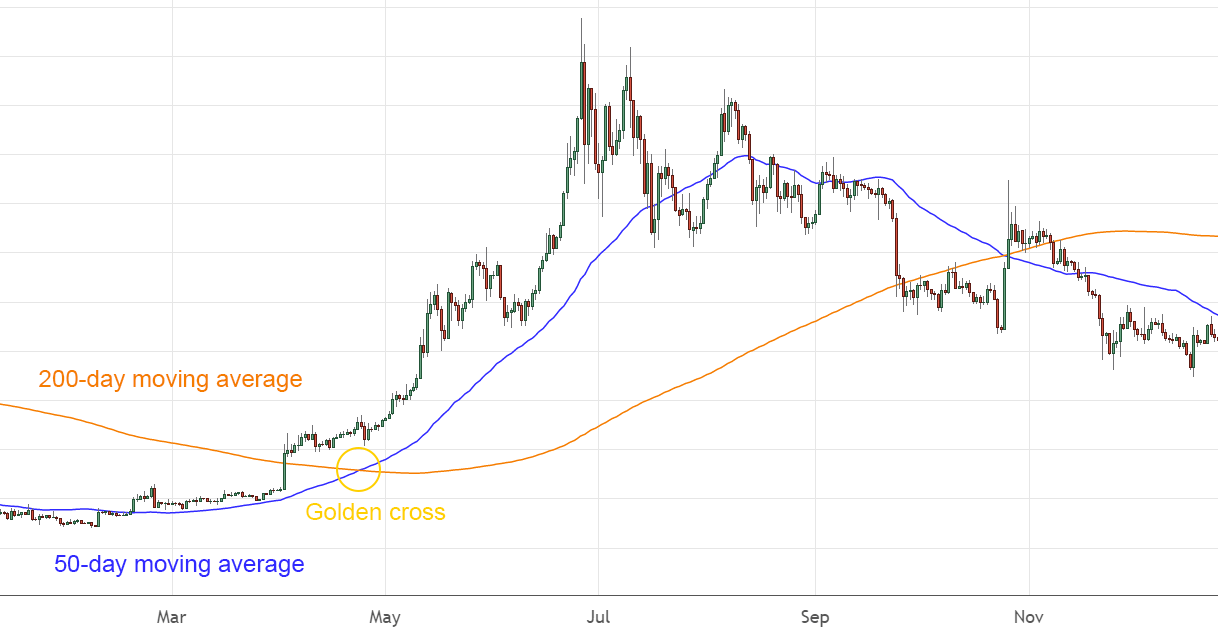
Figure 1 – A Bitcoin golden cross
Golden crosses are a major event in the market. A golden cross occurs when a short-term moving average crosses above a long-term moving average. In most cases, the short-term moving average has a period of 50 days, and the long-term moving average has a length of 200 days. Analysts interpret a golden cross pattern as a strong signal that the market is shifting towards a bullish trend. Figure 1 shows a Bitcoin golden cross event and the resulting upwards price action.
What is a death cross?
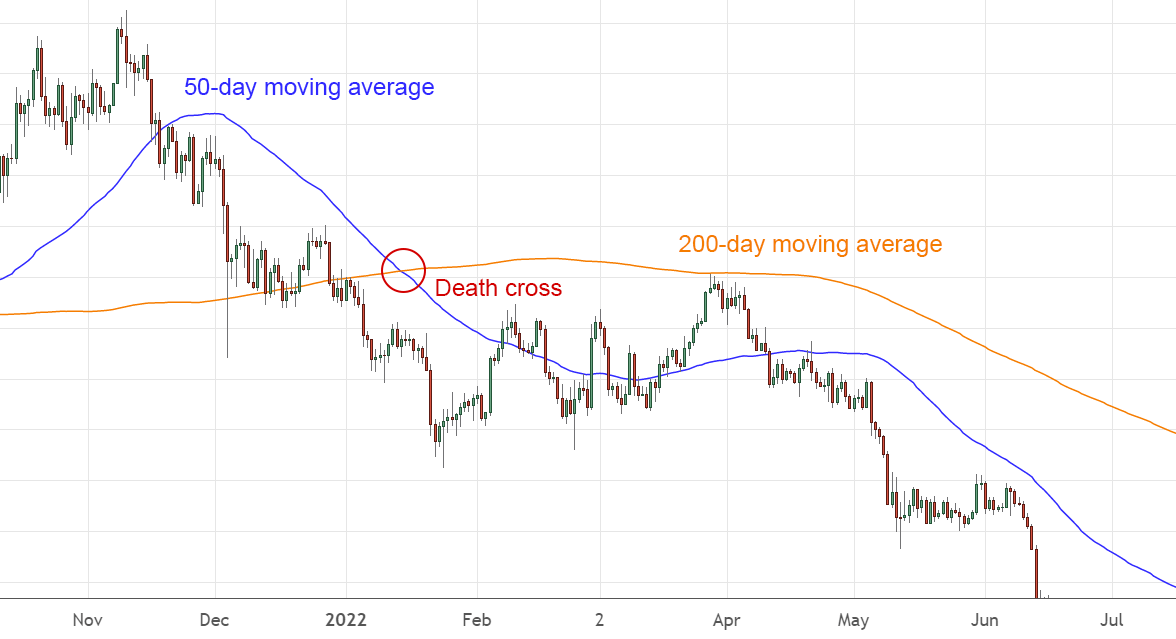
Figure 2 – A Bitcoin death cross
A death cross is the opposite of a golden cross. It occurs when the short-term moving average crosses below the long-term moving average. The event of a death cross suggests a potential change in market dynamics towards a bearish trend. Figure 2 shows a Bitcoin death cross event and the following negative price action.
Tip
Historically, the long-term moving average has become a level of support or resistance after a golden cross or death cross event. Figure 2 offers a good example of the long-term moving average acting as a resistance level following a death cross.
How to trade the golden cross and death cross
Investors using a golden cross trading strategy will generally buy just after the golden cross has been confirmed. Traders will then look to sell after a death cross has been confirmed. The golden cross strategy has proven to be quite effective with Bitcoin, as has the accompanying death cross strategy. However, like all trade signals, there are also cases of false signals as well. To help filter out false signals, it is always beneficial to use signals from other technical indicators for confirmation.
Special considerations
Golden and death crosses are lagging indicators as they are based on historical data. Lag is the time between when a trend starts and when the signal appears on the chart. Lag can result in missed opportunities to earn profits or mitigate losses when trading with golden and death crosses. One way to reduce lag is to use shorter periods. Some traders opt for 50-day (short-term) and 100-day (long-term) moving averages. The shorter period recognises trends sooner, but this comes at the cost of more false positives.
Golden and death cross events occur in other timeframes as well, longer time frames generally produce more robust signals. Short-term traders like to use cross events on smaller chart timeframes such as 5-minute, 15-minute and 1 hour.
It’s important to remember the timeframe that your golden cross or death cross trading strategy aligns with. If you are placing long-term trades, it would be effective to look at longer time frames. Sometimes a golden cross event might occur on the 15-minute chart, but the weekly chart might indicate a death cross.
How reliable are the golden cross and death cross signals?
Historically, golden cross and death cross events are perceived to be reliable trading signals. As with all trading signals, it is not guaranteed to produce results every time. There are instances of false signals, where the market did not trend in the direction that the cross suggested. Experienced traders analyse multiple trade signals instead of solely relying on golden and death crosses. Having multiple confirmations from different indicators provides a stronger signal, whether buying or selling.
Did You Know?
Trading volume is a popular signal often used in conjunction with golden and death crosses. Trading volume is a graph that represents the total number of units being traded; high trading volume at the time of a crossover event gives a stronger signal.
Summary
Golden and death cross events are lagging indicators that utilise a set of two moving averages. A golden cross and a death cross are the opposite of each other. Golden cross events signal bullish trends, whilst death cross events signal bearish trends. Both signals have performed reliably in the past for confirming trend reversals, especially when used concurrently with other technical indicators such as trading volume and the moving average convergence divergence (MACD).
Disclaimer: The information on Swyftx Learn is for general educational purposes only and should not be taken as investment advice, personal recommendation, or an offer of, or solicitation to, buy or sell any assets. It has been prepared without regard to any particular investment objectives or financial situation and does not purport to cover any legal or regulatory requirements. Customers are encouraged to do their own independent research and seek professional advice. Swyftx makes no representation and assumes no liability as to the accuracy or completeness of the content. Any references to past performance are not, and should not be taken as a reliable indicator of future results. Make sure you understand the risks involved in trading before committing any capital. Never risk more than you are prepared to lose. Consider our Terms of Use and Risk Disclosure Statement for more details.