)
Key Takeaways
Mapping out scenarios and ideas that could influence market direction in the new quarter.
Options markets have passed a major US $14 billion expiry period; how this impacts market dynamics and what lies ahead.
Outlining key labour trends. Why it matters and how it's affected the crypto market in recent times.
Chart of the week: Bitcoin Technical Levels
After catching up with friends this weekend, I was surprised by how many people were asking, ‘How’s crypto going?’, and as a nice change of pace it actually didn’t feel sarcastic.
I was diplomatic in my answer but didn't shy away from my perspective: Things might be about to get interesting. So, when I sat down to do this week’s Squawk I wanted to share some of the key ideas I’ve been thinking around the crypto market, attacking it from a few angles.
Now, I want to start off by acknowledging that these are just views, and not prescriptions on what comes next. We have seen in recent times how volatile the markets have become based on geopolitical events, things out of our control. But we can still start thinking about a framework about how the markets are currently poised.
Now to set things up, total crypto market cap (as measured by TOTAL in TradingView) has closed the first quarter of 2026 with a -20% loss, sitting at US $2.32 trillion. It’s a rough continuation of what we saw in Q4 2025 (-23%). So that’s more than a -40% decline over the past six months – and that’s the key story here. Are we approaching a point where the market might start offering some price relief, or is the downward pressure going to continue?
Let's dig in.
Market structure drivers
Here’s something you might not know: Options markets can influence spot price of assets, because exchanges on the other side of those trades often need to hedge their client’s exposure, to avoid market losses themselves.
If a large amount of open interest is clustered around certain price levels and expiry is getting close, those hedging flows can pick up and start driving short-term market moves. Once expiry passes and that hedging pressure eases, some of the chop and volatility can settle with it, allowing trends to potentially form more willingly.
According to Bloomberg, US $14 billion in Bitcoin options were set for expiry at the end of the month. What makes this noteworthy is that it’s both monthly and quarterly option contracts. This overlap of contracts with different durations expiring close to the same time isn’t frequent, and amplifies what I just mentioned above. This weight of open interest could be a potential driver for why we have seen prices remain range bound in recent times.
Now with this market force lifting, the next largest contract by date and value sits at US $14.7 billion, with expiry between the 24th and 26th of April.
This means we could see some time and space for a trend to form, either up or down, without the intervention of option dealer desks.
Economic backdrop
A key trend right now is the worsening of the labour market, particularly in the US – the largest consumer base in the globe.
If there are less jobs out there while overall employment rate is falling, that can mean consumer spending behaviour will take a hit. You could make the case that soaring energy prices in recent times aren’t helping household expenditure right now either.
But here is the kicker, consumer spending is needed to keep an economy’s growth running steady, or ideally, expanding. Currently, consumers drive 68% of gross domestic product (GDP) in the US.
So any hit here will likely have a tail-on effect as we move into the back end of 2026. So let's take a look at the trend so far.
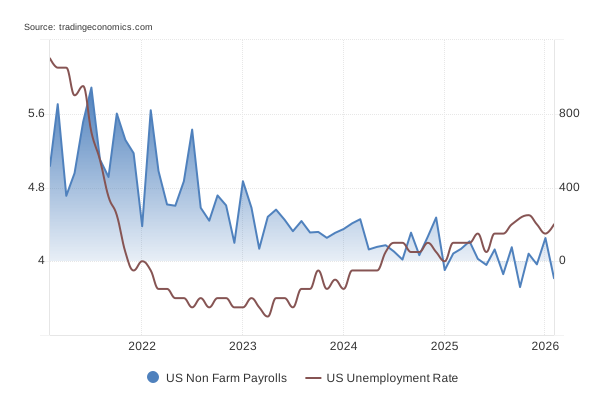
Key jobs data landing is early this month, and I believe that will set an important tone moving forward. The US Bureau of Labour Statistics will release the latest updates on March 3rd at 10:30pm AEST.
As a reminder, last month’s jobs data landed at -92,000 removed from the market, when 58,000 new jobs were expected. That is a big divergence. Currently, market forecasts are for 65,000 jobs to be created. When this lower-than-expected data point landed last time, we saw a -3.2% drop in total market cap on the 6th of March. If this release again surprises the market, crypto could react sharply.
Chart of the week: Bitcoin Technical Levels
Technical analysis is often referred to as more astrology than science, and that’s fine. Different strokes for different folks. But it does only one thing that I care about, it shows how the market is behaving over time.
As more information is digested, technical analysis can show us how all the different incentives in the market are currently moving.
I’ve mapped out the below chart on some key time-based data points, alongside a Bollinger Band. This is a simple technical analysis tool that shows when a market is stretched from its average.
)
When we look at this chart, we can see on four separate occasions since February, price action has retraced toward the upside after breaching the lower Bollinger Band. This suggests a consistent lack of downward momentum at these levels, as the market has historically found support following these oversold signals.
We can make an assumption that buyers stepped in at these lows, making it key to understand where those buyers could be flipped into sellers. I can see two possible broad outcomes.
To the upside | If the assumption is correct that we are seeing buyers step in and accumulate at this local low, any of the above yearly or quarterly price data points are all relevant targets where they might exit. It’s all about watching how the market behaves when we get there.
To the downside | Failure for these support buyers to remain in their positions could see prices continue to fall. This would likely see BTC price falling under the lower range of the Bollinger Band, heading towards the previous quarter low and beyond.
Again either of these two outcomes are just ideas - so hopefully this gives a lens on how to think about macro and technicals moving into the fresh month and quarter. Likely we get some more steer as the market matures into the weekly close on Monday.
As always, we never have a crystal ball. We can just be prepared for the possibilities and plan and act accordingly.
See you again next time.