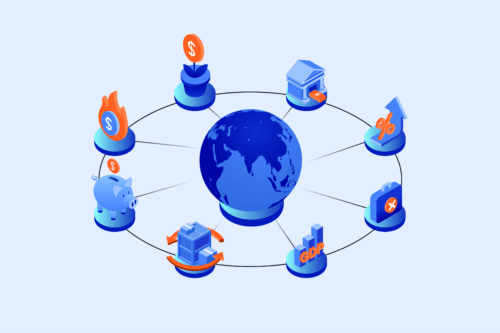
There are many tools you can use to understand the economic landscape. But perhaps none paint quite as big a picture as the gross domestic product (GDP). This metric captures a nation’s economic size and can be used to determine if they are in a growth or contraction phase.
Though there are flaws with reading GDP in isolation, it can be a powerful and quick way for investors to gauge a country’s year-on-year economic performance. Understanding the push-and-tug of economic cycles can provide important context to global trends and help inform investment decisions.
What is economic growth?
Economic growth is the increase of a nation’s economic output over time. The first — and less accurate — definition, known as nominal growth, tallies the price and volume of production within a nation.
While useful, nominal economic growth can misrepresent a nation’s health as it doesn’t factor in inflation. This can mean that, even in a technically ‘growing’ economy, the average individual may actually have less to spend.
Therefore, Australian economists prefer to use ‘real’ economic growth. This metric looks at just the production volume of a country over time, rather than its dollar value — accounting for inflation. Real economic growth considers business, government and consumer activities.
Did You Know?
Economic growth factors in all sorts of outputs, like how much iron ore Australia exports, how many new houses are built and sold, how many fancy dinners out couples have on Valentine’s Day, how much wheat and milk are produced by farmers, and so on.
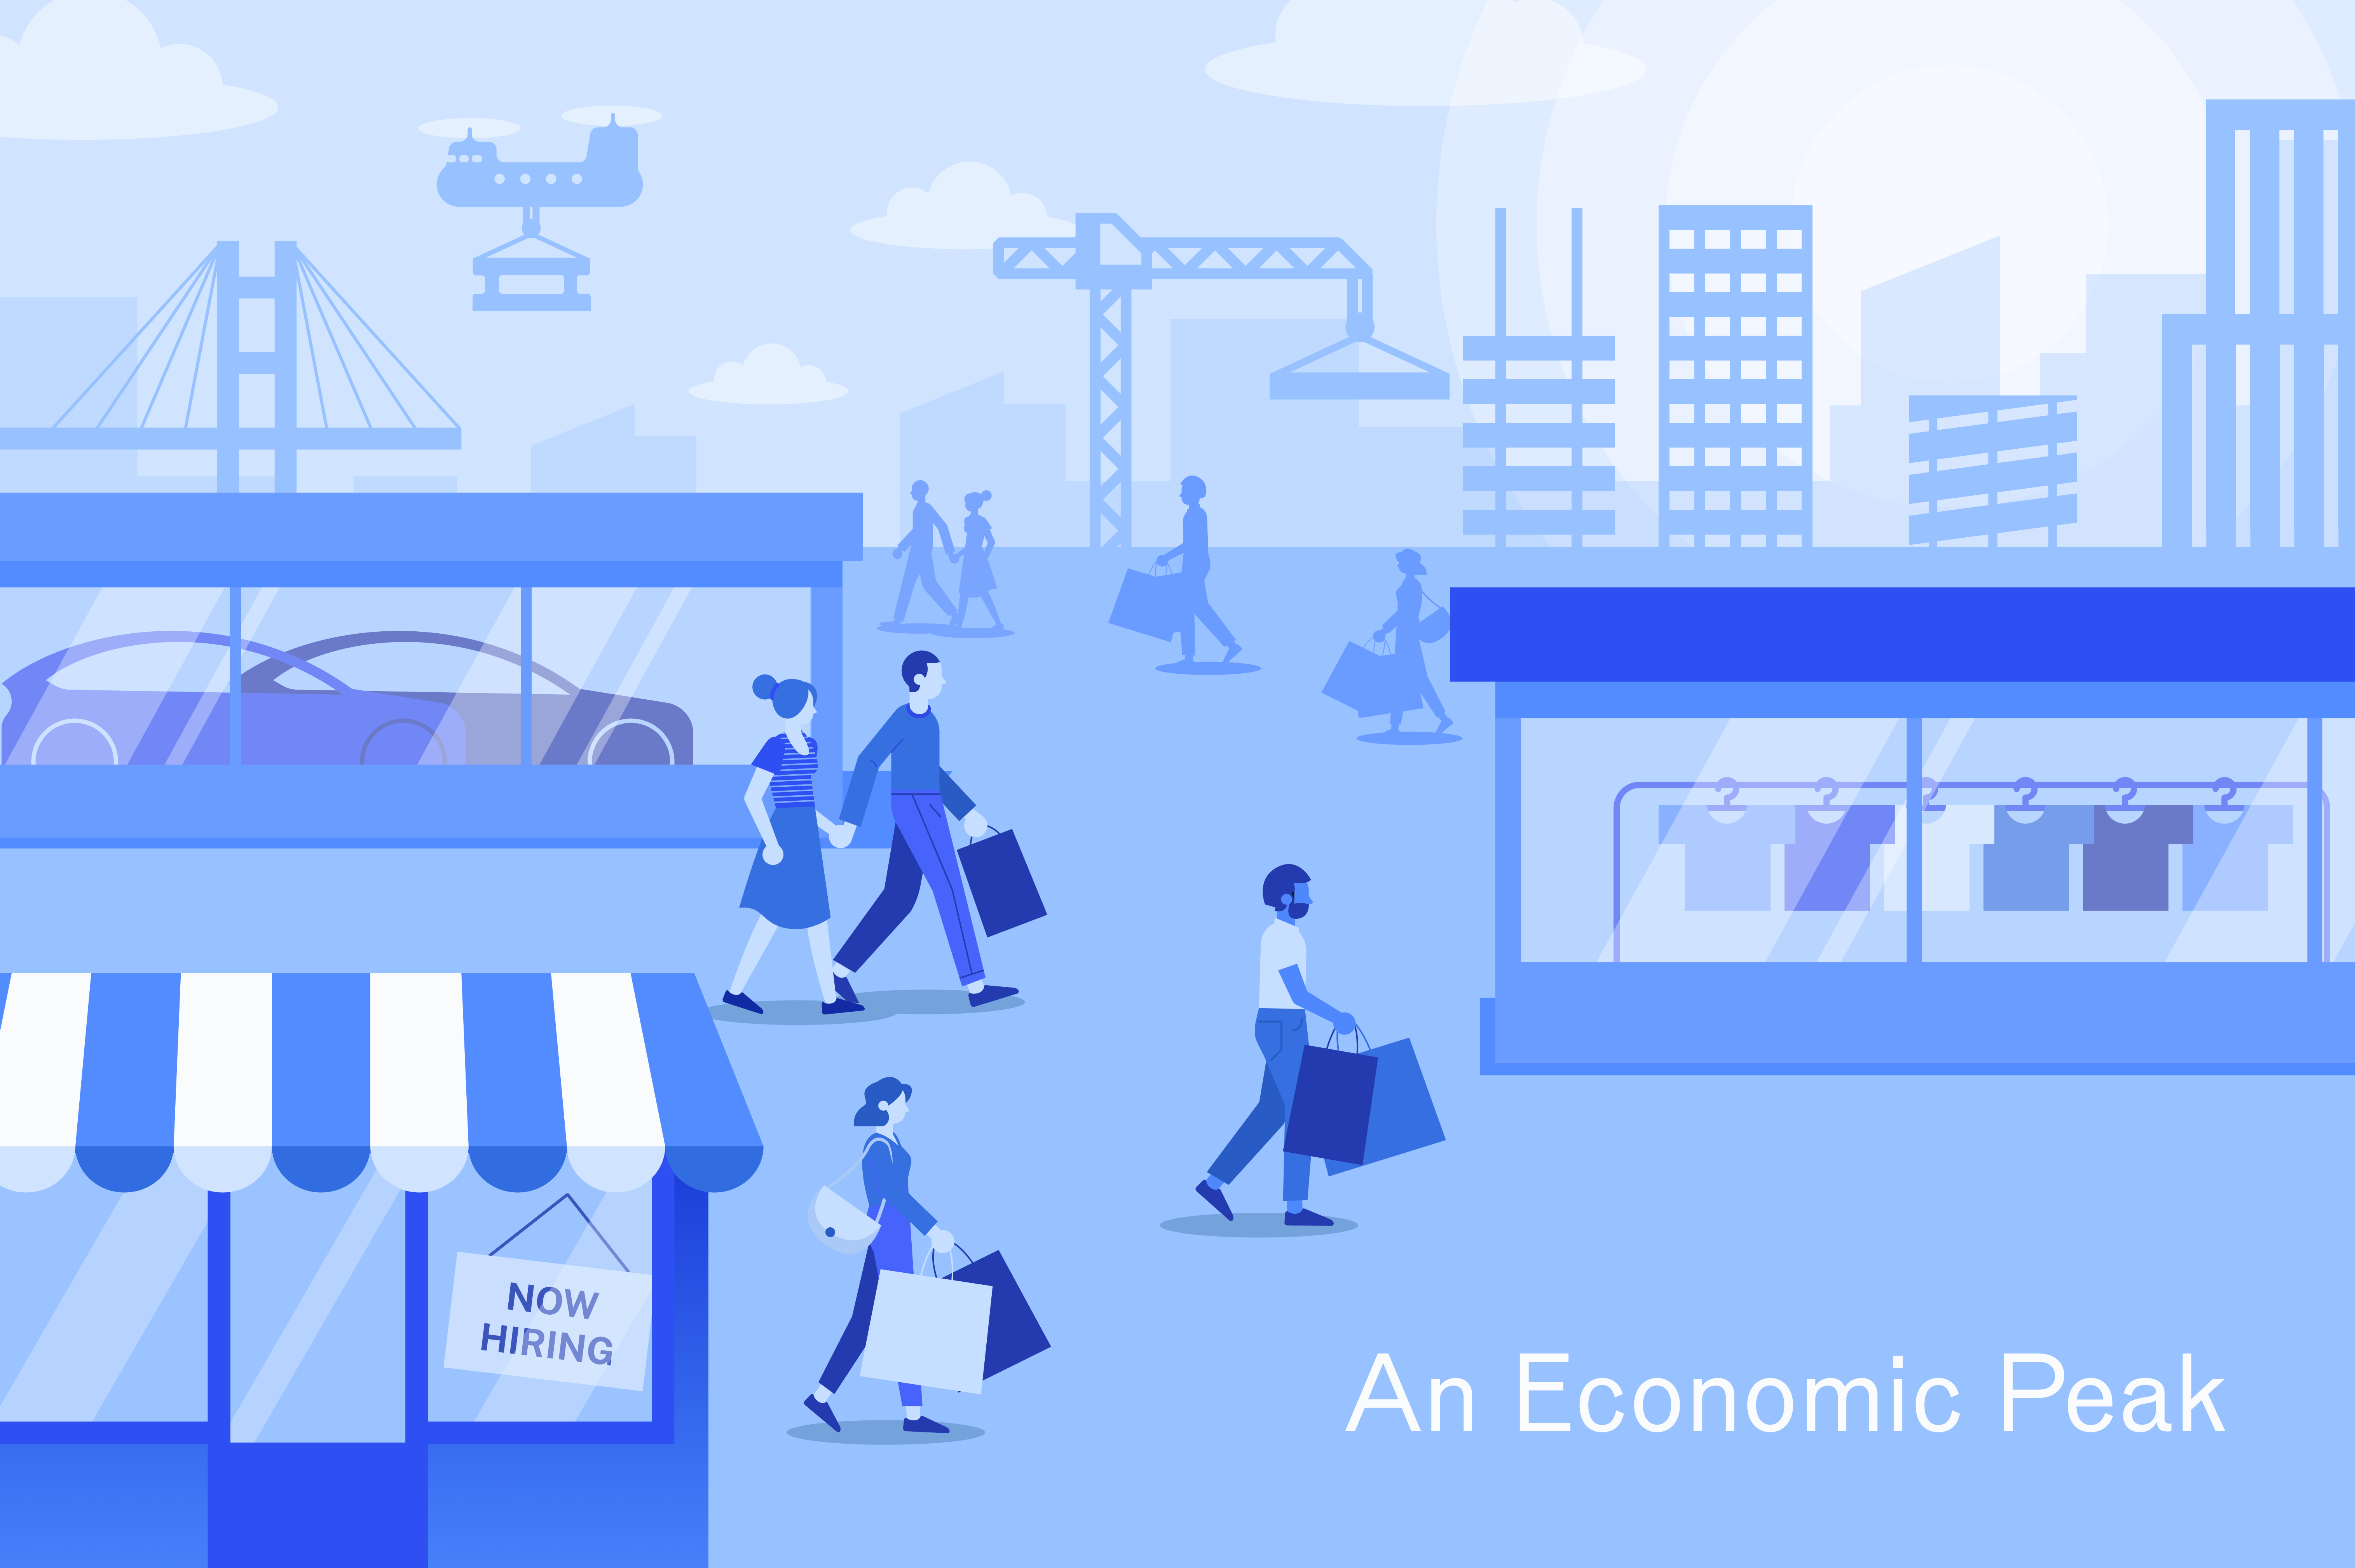
Measuring economic peaks: The good times
Imagine this:
You’re walking down the street on a vibrant, sunny day. The city’s cafes have lines coming out the door, with storefronts sporting ‘Now Hiring’ signs everywhere you look. Restaurants are booked out for weeks, the skyline is bustling with cranes as new roads and bridges are erected throughout the nation and shopping bags from designer brands hang on the arms of passersby.
This is what you might see during an economic peak.
Periods of strong economic growth are marked by a rising real GDP, which in turn has a significant effect on other macroeconomic factors.
With production increasing, businesses need more hands on deck to meet rising demand. This typically results in a lower unemployment rate, growing wages and more money in people’s wallets.
With more cash floating about, companies, governments and consumers are likely to spend more, whether it’s on infrastructure projects, new tech research or the latest trendy smart watch.
During ‘the good times’, extra liquidity means people and institutions are more likely to invest in high-growth, riskier assets (such as cryptocurrency), and less inclined to save through lower-risk, slower-return products (such as a high-interest savings account).
Measuring economic recessions: The bad times
The image of a recession can sound like something out of a post-apocalyptic movie. Abandoned shops, cobwebs climb over ‘Closed Permanently’ signs as people line the streets with their earthly possession tethered to their backs.
And while most economic recessions never come close to this level of despondency, they have before.
The Great Depression is a historic example of when the bad times went really bad.
Scouring sources from this era can give us a window into the past, presenting a glimpse of how devastating an economic downturn can be.
Jimmy Carter –
‘In the Great Depression in which I grew up and remember vividly, unemployment was over 25 percent, and over 35 percent where I lived. A grown man would work all day, 16 hours, for a dollar. I remember hundreds of people walking by, people who had come down from the North just to get warm. They would come to our house as beggars even though they might have a college education. People didn’t have money. They bartered; they’d trade eggs or pigs. It was just completely different.’
Severe economic downturns are marked by a decrease in sales and services due to decreasing demand. As productivity drops, unemployment typically rises.
This can quickly lead to a drop in the average wage, and people’s belts get tighter as money becomes significantly harder to come by.
With limited access to cash, people often turn away from riskier investments like crypto, spending less and saving more to cope with potentially losing their jobs or cash flows.
Key Takeaway
The above are two extreme examples of the economic cycle. Typically, Governments will try to avoid such drastic economic environments through policies like shifting interest rates, infrastructure incentives and budgeting. Though the ‘good times’ of booms seem appealing, they can quickly run wild with devastating consequences. Most nations strive for a ‘smooth’ economic cycle with relatively stable peaks and troughs.
The phrase ‘the bigger they are, the harder they fall’ comes to mind.
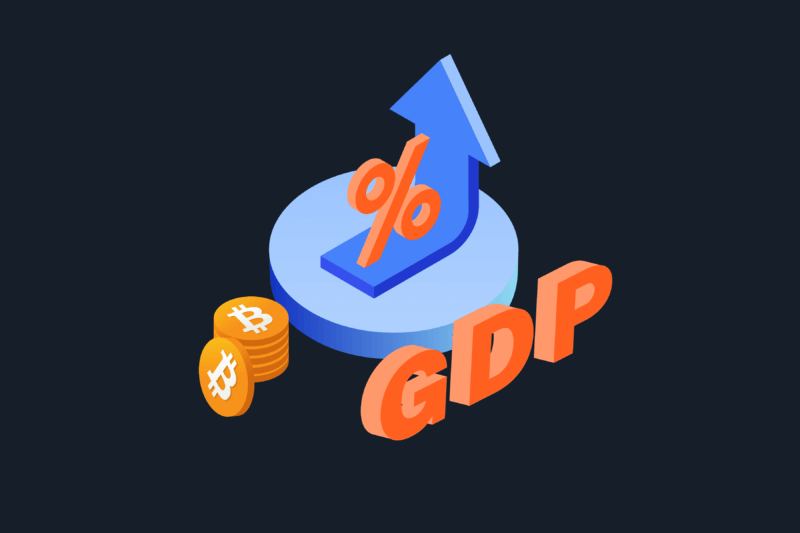
Understanding Gross Domestic Product
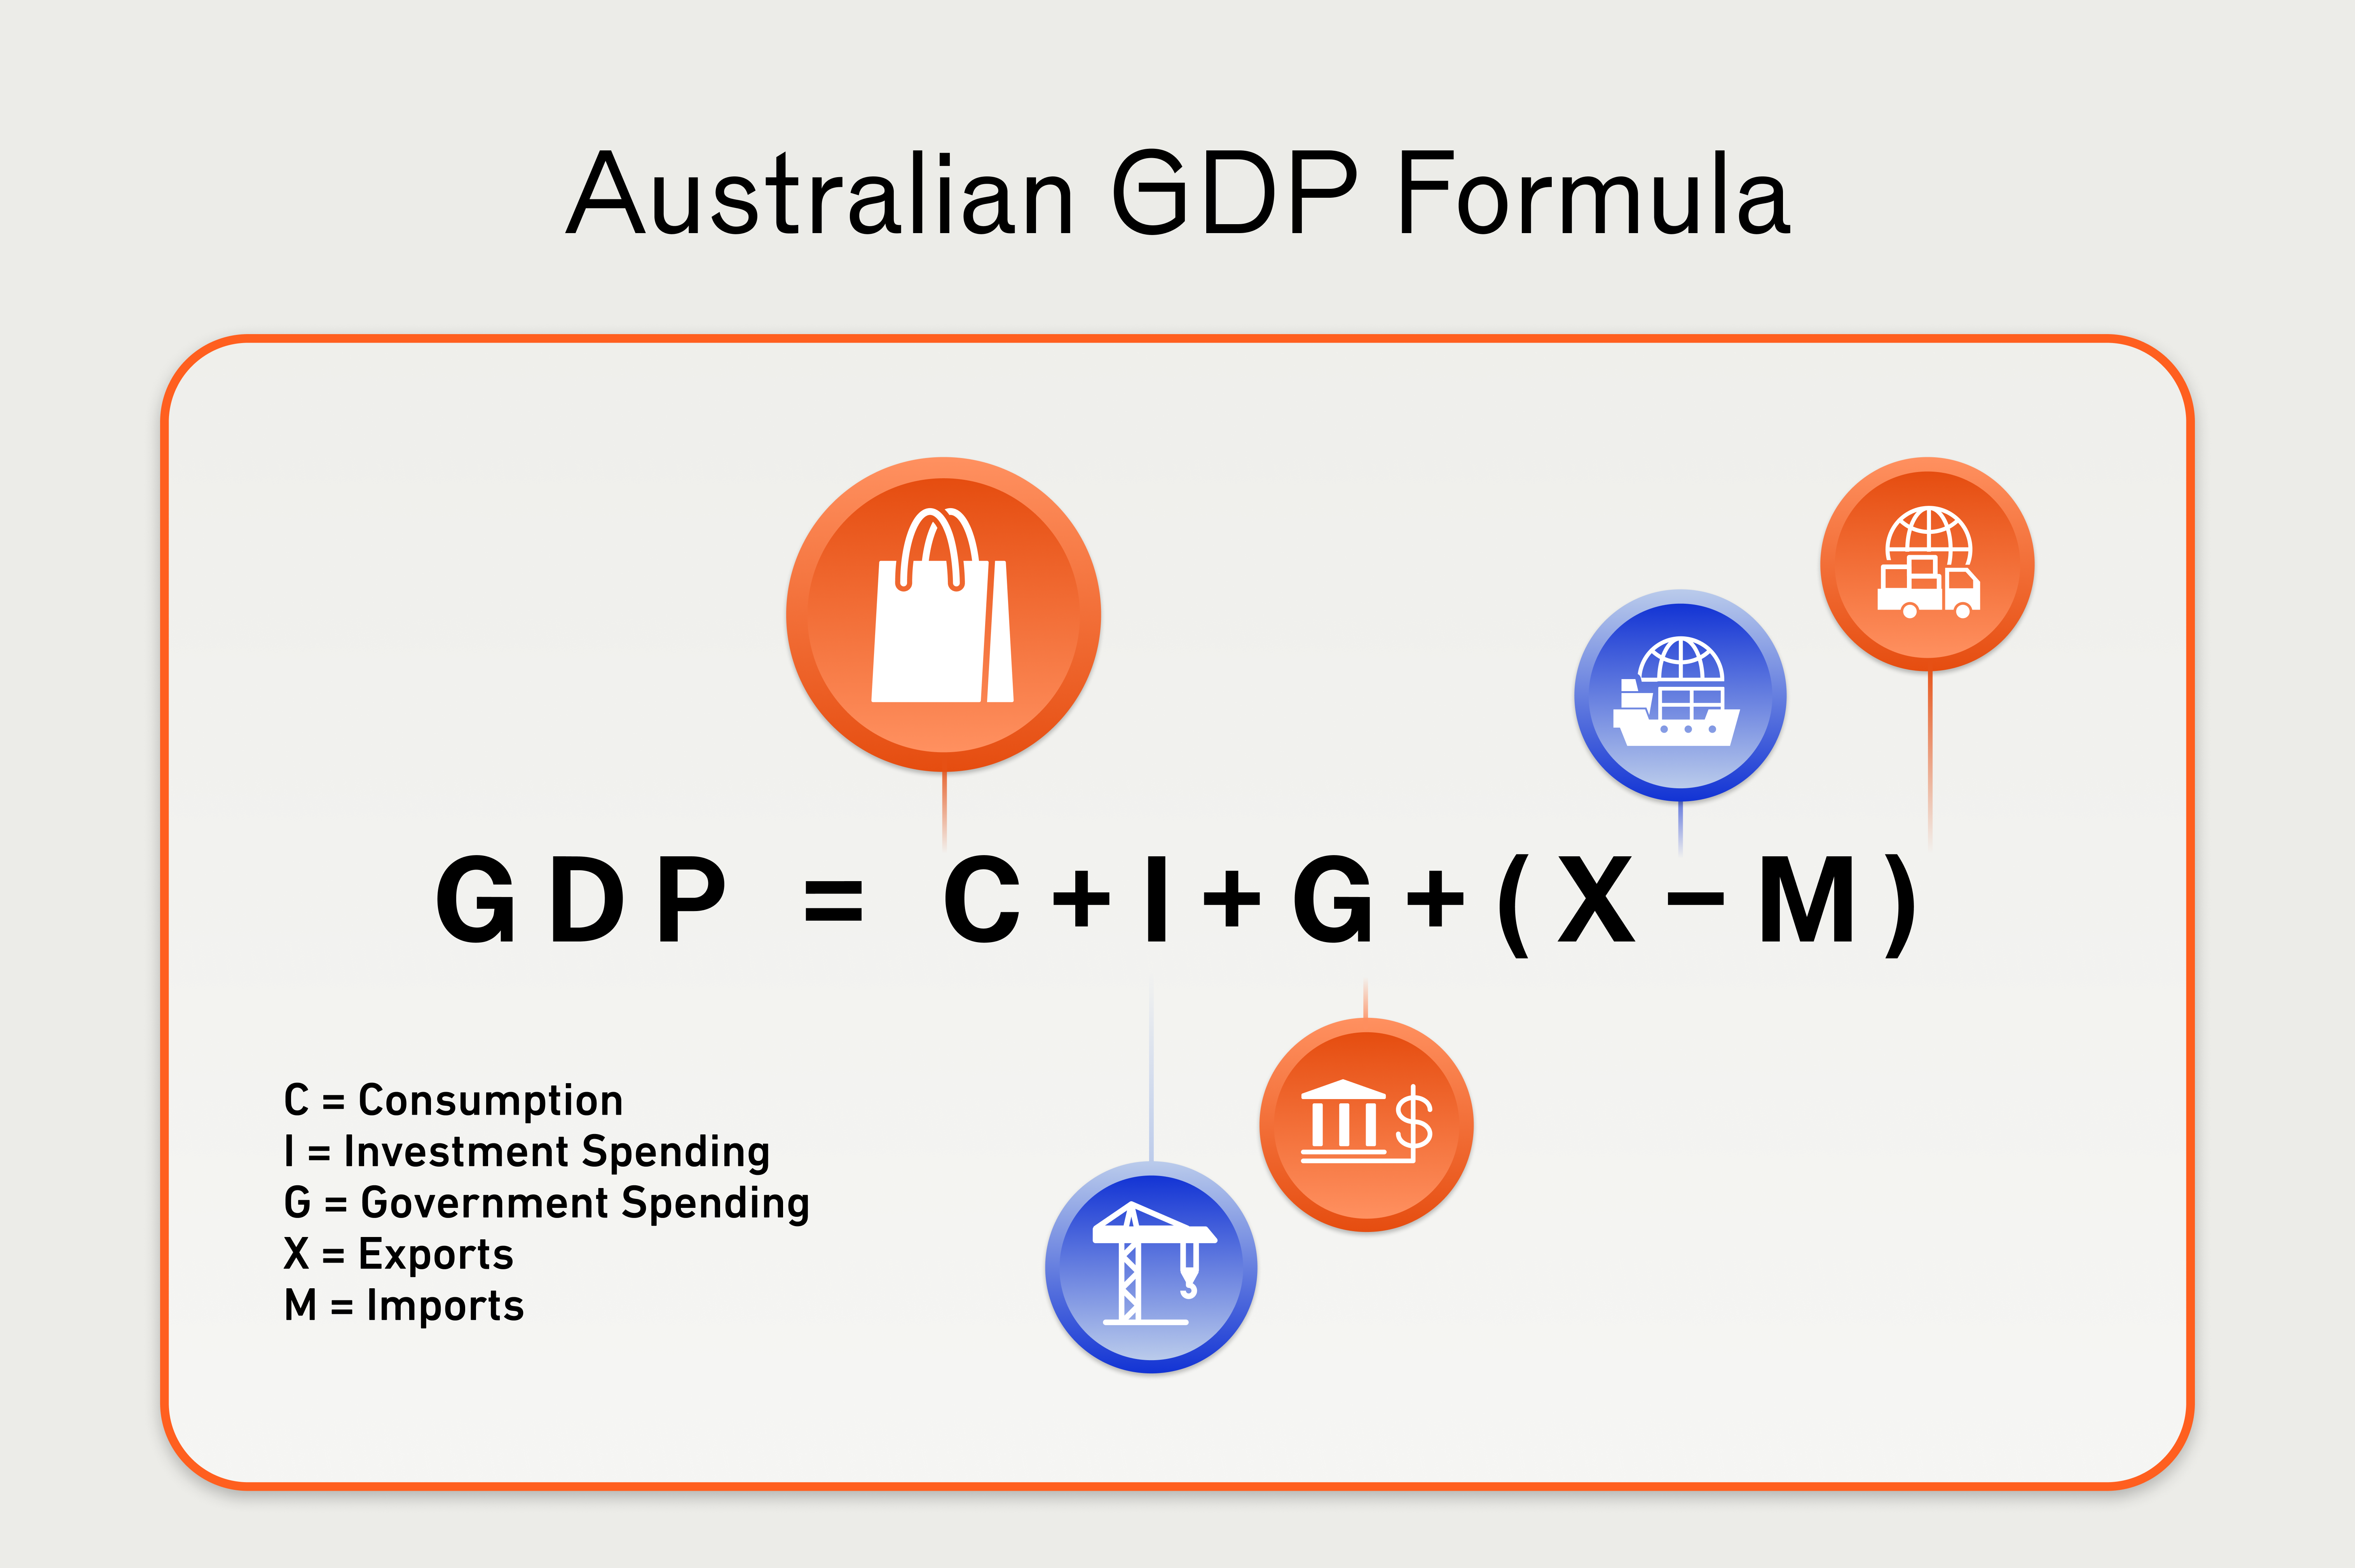
Gross Domestic Product, or GDP, is the primary metric used to measure a country’s economic growth. It puts a numeric value to the total production of a nation within a set timeframe.
In Australia, the Australian Bureau of Statistics (ABS) calculates GDP by assessing data on total production from goods and services, total income from individuals and businesses, and total expenditure from business, individuals and governments.
These three approaches — production, income, and expenditure — essentially measure the same economic activity from different angles. Economists average them out to arrive at a more accurate GDP figure for Australia.
As discussed previously, GDP can then be calculated based on its current dollar value (nominal GDP) or by adjusting for inflation (real GDP).
Although GDP can be a powerful tool for measuring a nation’s economic performance over a timeframe, it isn’t without its flaws.
- GDP doesn’t capture all economic activity. Significant drivers like charity work or stay-at-home child care aren’t included in calculations.
- GDP doesn’t reflect income distribution. While an overall economy might be booming, this does not necessarily mean the average citizen is benefiting. Wealth may be concentrated in certain pockets, or a nation’s population might be outpacing GDP growth.
- GDP doesn’t measure long-term sustainability. Increased spending may be a result of disaster relief, or resource depletion. This can have a short-term ‘positive’ impact on economic productivity, while long-term health may be compromised.
Summary
Economic growth can be a powerful tool for investors to better understand macroeconomic cycles. Increasing global GDP metrics can symbolise an economic boom, which often correlates with strong market performance. Inversely, economic pullbacks often result in less spending and declining investment in risky assets such as equities and crypto.
Next lesson
Disclaimer: The information on Swyftx Learn is for general educational purposes only and should not be taken as investment advice, personal recommendation, or an offer of, or solicitation to, buy or sell any assets. It has been prepared without regard to any particular investment objectives or financial situation and does not purport to cover any legal or regulatory requirements. Customers are encouraged to do their own independent research and seek professional advice. Swyftx makes no representation and assumes no liability as to the accuracy or completeness of the content. Any references to past performance are not, and should not be taken as a reliable indicator of future results. Make sure you understand the risks involved in trading before committing any capital. Never risk more than you are prepared to lose. Consider our Terms of Use and Risk Disclosure Statement for more details.
 Article read