Key Takeaways
- Institutions continue to accumulate as US Bitcoin Exchange Traded Funds (ETFs) show seven consecutive trading days of net buying.
- GameStop greenlights Bitcoin, adding the digital asset to their approved list of treasury assets.
- Chart of the week: Bitcoin’s Market Value vs Realised Value. Using blockchain analysis to identify historic periods where Bitcoin is extremely over or undervalued relative to its ‘fair value’.
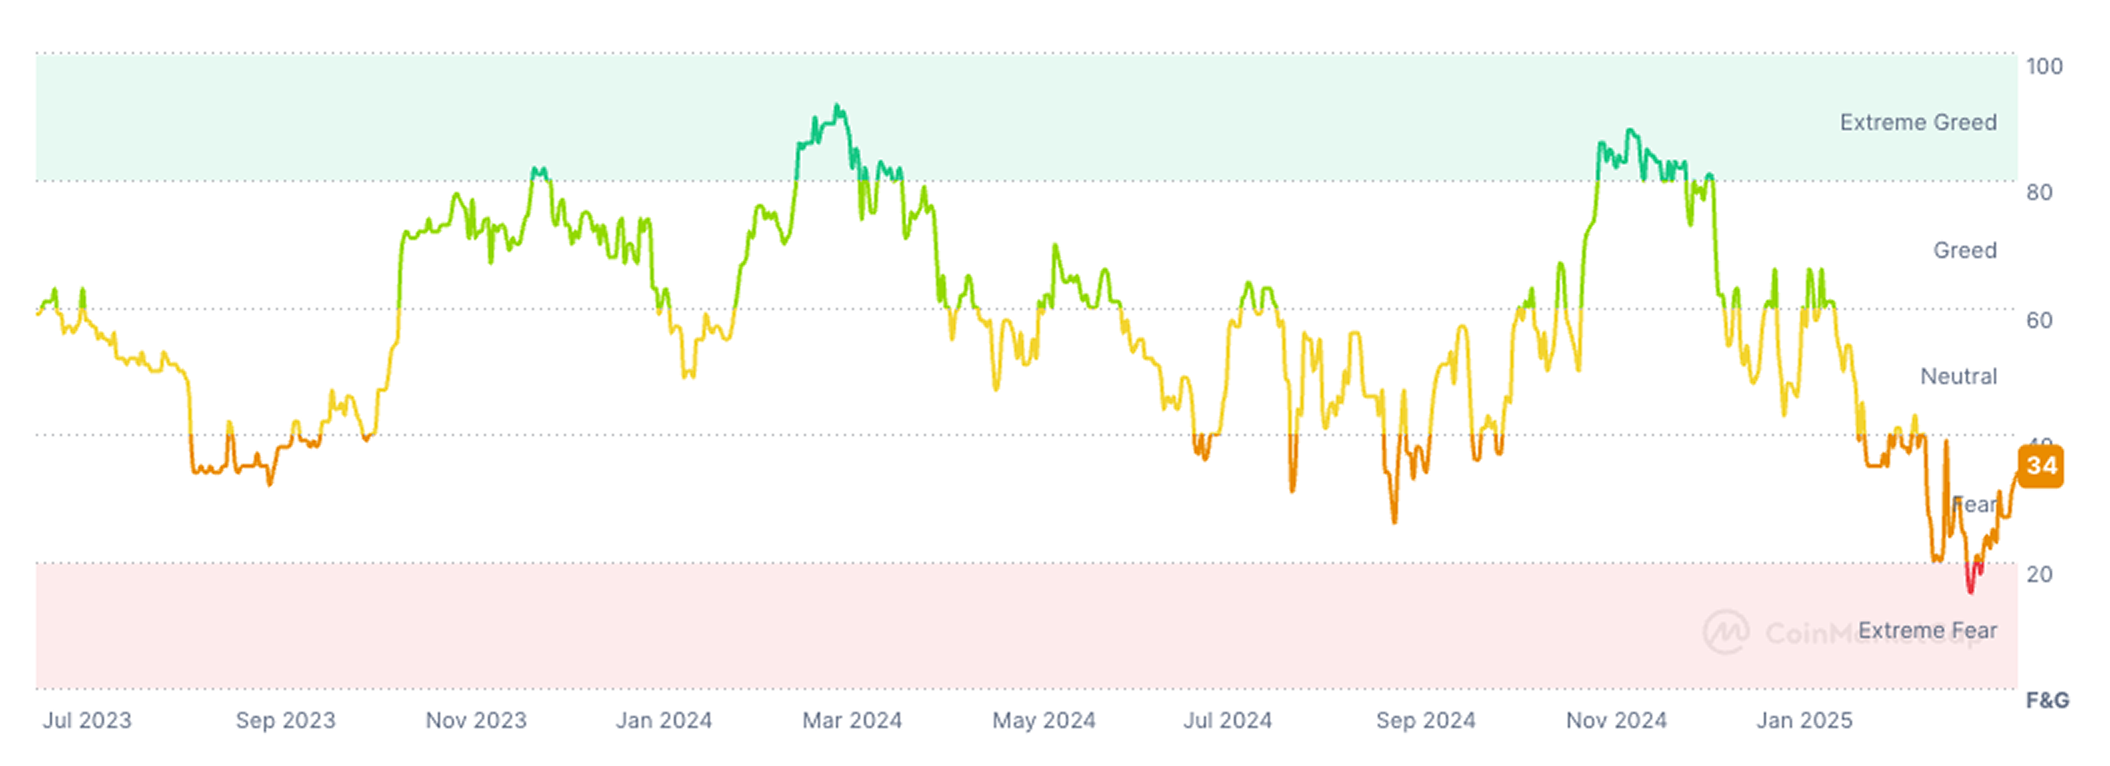
The market is scared, and why wouldn’t it be after we’ve witnessed a 30% capitulation on Bitcoin to kick off 2025. And that’s not to mention the >50% drop we’ve also seen across altcoin markets. Although The Fear and Greed Index is slowly recovering from its multi-year lows, it still firmly reads Fear.
Institutions adoption proliferating
GameStop has officially thrown their hat into the ring, joining the ranks of Michael Saylor’s Strategy in a quest for more Bitcoin. A unanimous vote by their board this week has greenlit the addition of Bitcoin as a treasury reserve asset.
GameStop became a household name during the 2021 stock market saga where Reddit’s r/WallStreetBets community gave birth to a ‘David vs. Goliath’-like story. Upon finding out hedge funds were preying on GME’s demise through heavy short positions, hordes of retail investors traded together to squeeze the institutions out. This resulted in big losses for funds and trading desks, and sent GME stock sky-rocketing. Check out “Dumb Money” on Netflix, a great documentary capturing this meme-stock frenzy.
This week we have also seen more buying from Strategy, with Michael Saylor posting that the companies holdings has now reached over 500,000 BTC – a huge milestone.
This now means Strategy holds 2.4% of the 21 million total supply of Bitcoin.
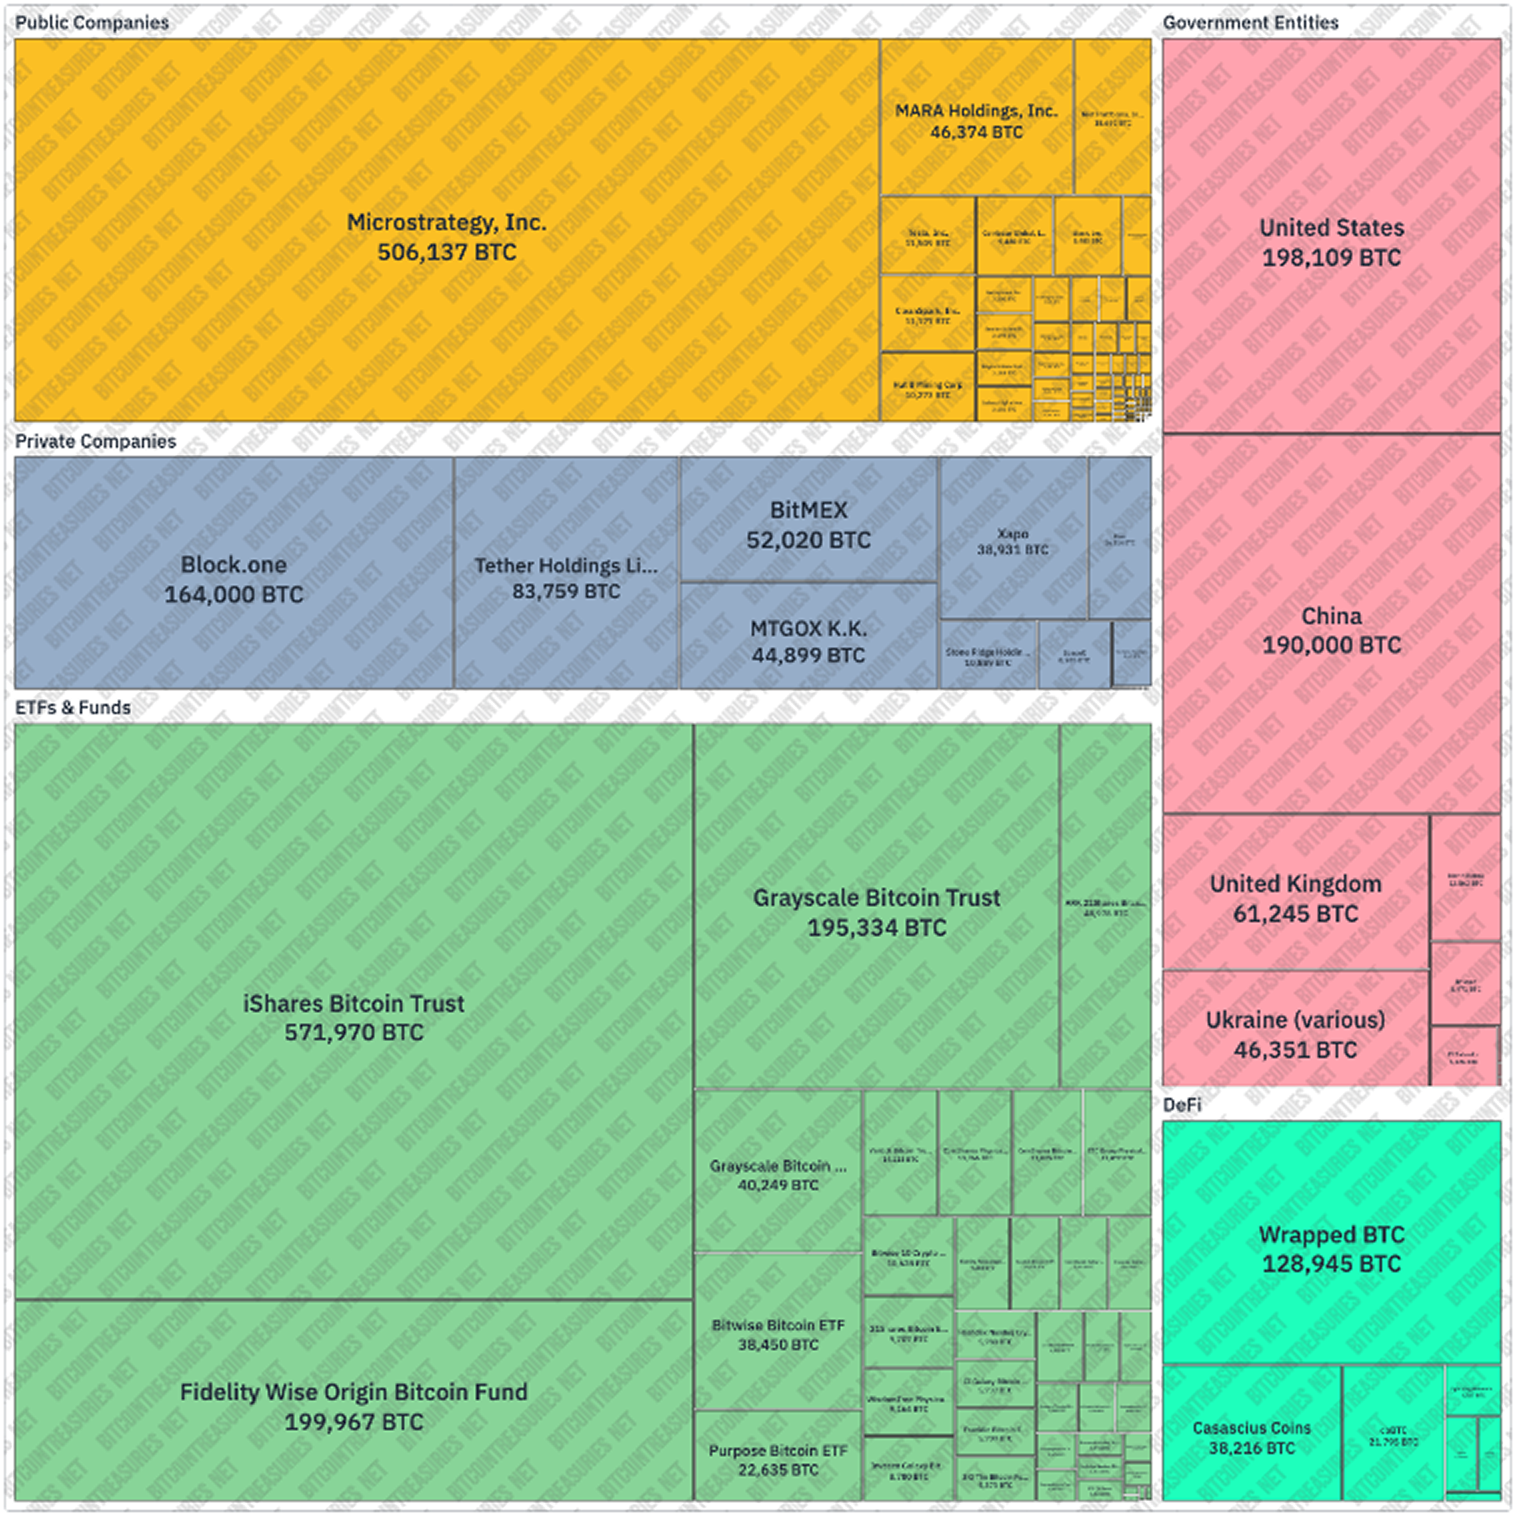
Chart of the week – Comparing Bitcoin’s Market Value (MV) against on-chain Realised Value (RV)
Don’t let the name scare you. There are three things you need to understand about the chart below.
- Black Line – Market value of Bitcoin
- Blue Line – Realised value
- Orange Line – Z Score between the two metrics above. This is a mathematical measurement to describe the relationship between the two in terms of standard deviations. How ‘stretched’ is the difference.
Think of Realised Value as a steady baseline for Bitcoin’s price. It’s measured by capturing the price of each Bitcoin when it was last moved between wallets, averaging those prices, and multiplying by the total number of coins in circulation.
So, it is a way to measure Bitcoin’s value while ignoring short-term market hype or fear that we see impacting prices.
The Z-score uses standard deviation measurements to show extremes, or how far apart, Bitcoin’s current price (Market Value) is from its on-chain average price (Realised Value).
Think of this chart as a datapoint that shows how stretched Bitcoin’s current market price is compared to an average price derived from on-chain movements.

Historically, periods where market value is close to the realised value have coincided with market bottoms. And conversely, large spikes are often seen when the inverse of this is true.
Currently this indicator is suggesting the value of Bitcoin is similar to October 2024. It also shows that there has yet to be an extreme move to the upside. This suggests that market prices have likely not topped yet this cycle relative to the realised value.
💱 Swyftx Flows

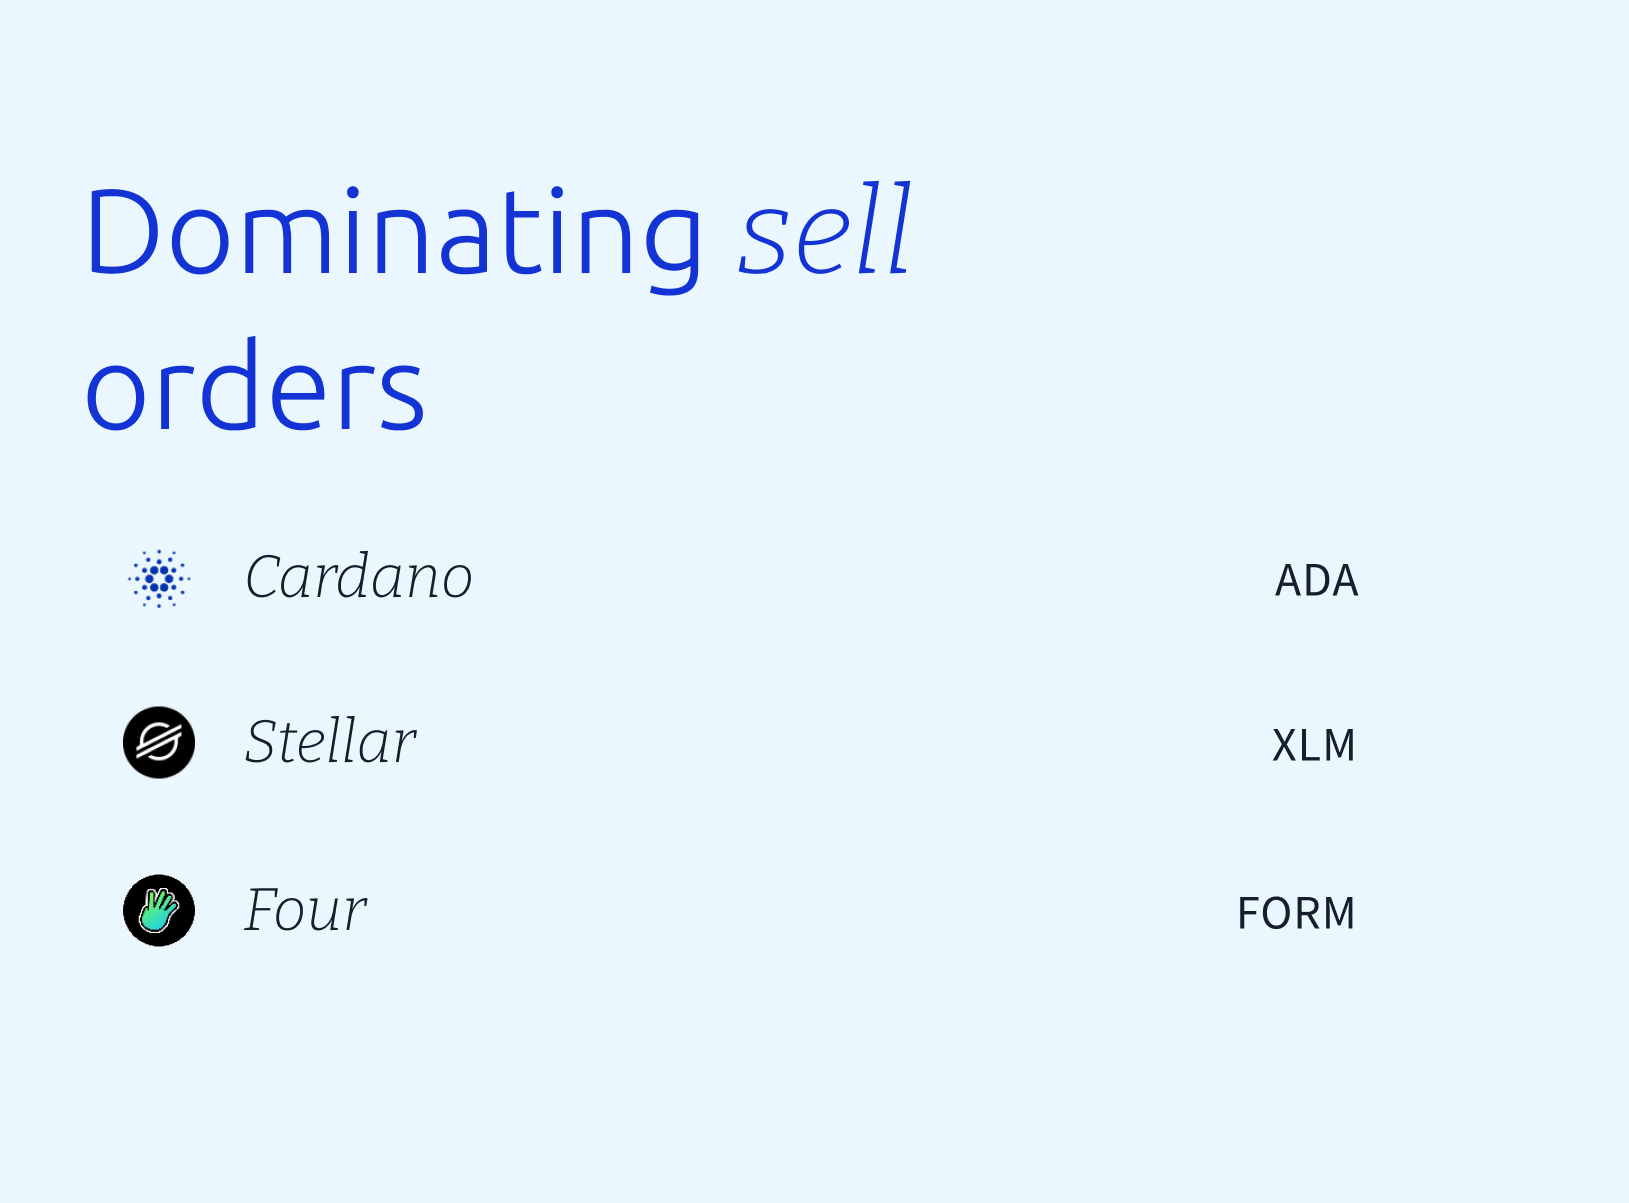
The buy-to-sell ratio for unique Swyftx orders is nominally >$20,000 AUD (rolling data over the last 7 days, captured at 09:00 am AEST).
Disclaimer: The information on Swyftx Learn is for general educational purposes only and should not be taken as investment advice, personal recommendation, or an offer of, or solicitation to, buy or sell any assets. It has been prepared without regard to any particular investment objectives or financial situation and does not purport to cover any legal or regulatory requirements. Customers are encouraged to do their own independent research and seek professional advice. Swyftx makes no representation and assumes no liability as to the accuracy or completeness of the content. Any references to past performance are not, and should not be taken as a reliable indicator of future results. Make sure you understand the risks involved in trading before committing any capital. Never risk more than you are prepared to lose. Consider our Terms of Use and Risk Disclosure Statement for more details.