It’s been a massive week for the digital asset space as more and more milestones are being ticked off. As Bitcoin has headed into $52,000 USD, investors who bought BTC near the top of the 2021 bull run are close to or near the break-even point. An estimated 91% of Bitcoin holders are currently in profit.
A lot of this positive price action has been directed at the persistent demand for spot Bitcion from the ETF products. And it’s not hard to see why this might be the case.
One-Way Traffic For Bitcoin ETF
Traditional finance has let their money do the talking, as we’ve seen sheer dominance on the buy side for Bitcoin ETFs, with 14 days straight of more buying than selling across all Bitcoin ETF products. This comes notably after a slow start, where the GBTC product experienced strong selling in its first seven days, which has now eased.
Overnight we saw an additional $750M USD in inflows for the BlackRock IBIT ETF product. This is an interesting development and trend to be paying close attention to while we head into the Bitcoin halving, where new supply will be cut in half.
Why This Matters
Persistent buying in large sums by institutions, plus there being less supply in less than 60 days’ time means a huge supply shock could be on the horizon.
In my opinion, it’s fundamentals like this that put more weight behind the script of Bitcoin continuing to move higher.
Bitcoin (BTC)
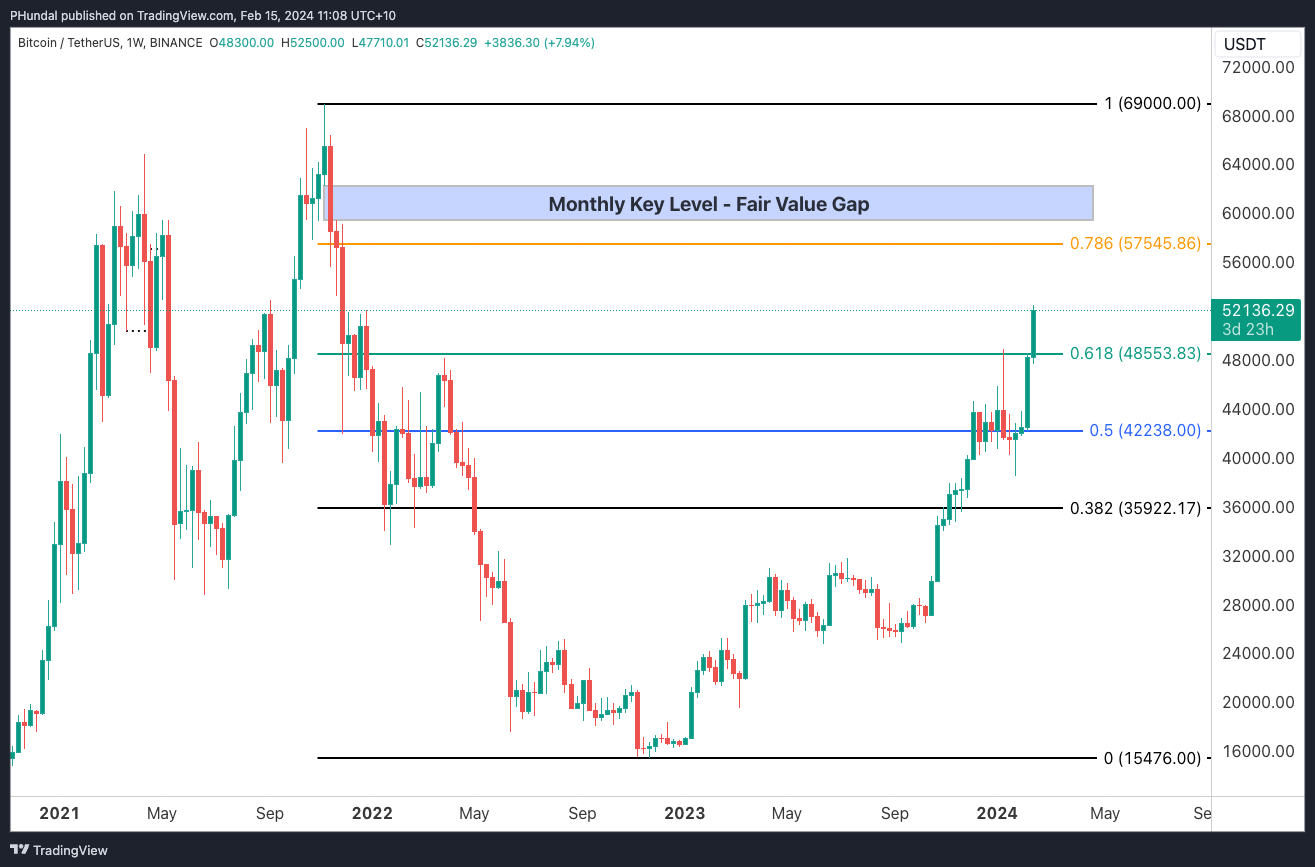
After the recent breakout on Bitcoin, we can now zoom out and assess how the market measures up. Using the Fibonacci analysis, we can take the previous all-time high and the range lows from the current cycle to create segments of technical interest—levels where investors and traders may see some significance.
Source: TradingView
Below are two higher time frame events that I am watching based on Fibonacci analysis of the previous all time high and the recent market cycle bottom.
Bullish scenario
Bitcoin bulls continue to hold prices towards the next level of interest which is the 0.786 Fibonacci level ($57,545 USD). From here we can wait to see if there is enough momentum to then potentially set up a new all-time high.
Bearish scenario
Failure from the bulls to keep their foot on the gas, and we start to lose the key 0.618 Fibonacci level ($47,553 USD). If we fail to reclaim the 0.618, we could see Bitcoin start to cool off.
Reminder! Altcoins are often hyper-reactive to the sentiment on Bitcoin, so I am expecting volatility pending the outcome.
Avalanche (AVAX)
AVAX made some big moves towards the back end of last year, especially with the ties to building a gaming narrative (GameFi). But recently it has been consolidating along with the rest of the market. Below are two potential higher time frame scenarios using Fibonacci analysis.
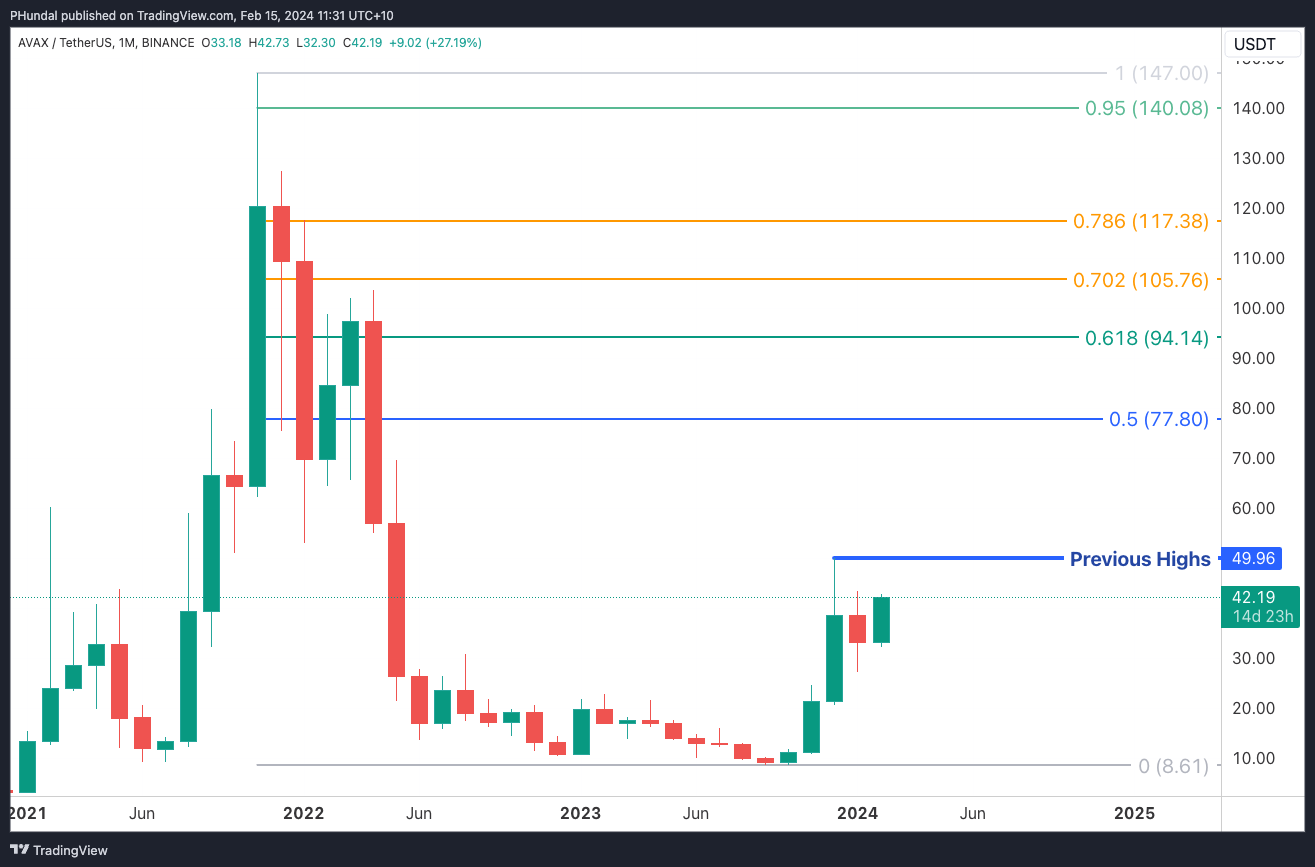
Mapping out AVAX from the previous all time high and current cycle low, we could draw the following analysis.
Bullish scenario
If the previous monthly high of $49.96 is taken out, bulls send prices higher. The next potential target could be $77.80, the midpoint of the range.
Bearish scenario
Failure to close above the monthly high of $49.96. This may result in prices falling lower.
Jito (JTO)
A newer member of the Solana ecosystem, Jito looks to bring the benefits of liquid staking to Solana. Simply put, a similar concept to Lido DAO on Ethereum, which has been a successful project to date.
Source: TradingView
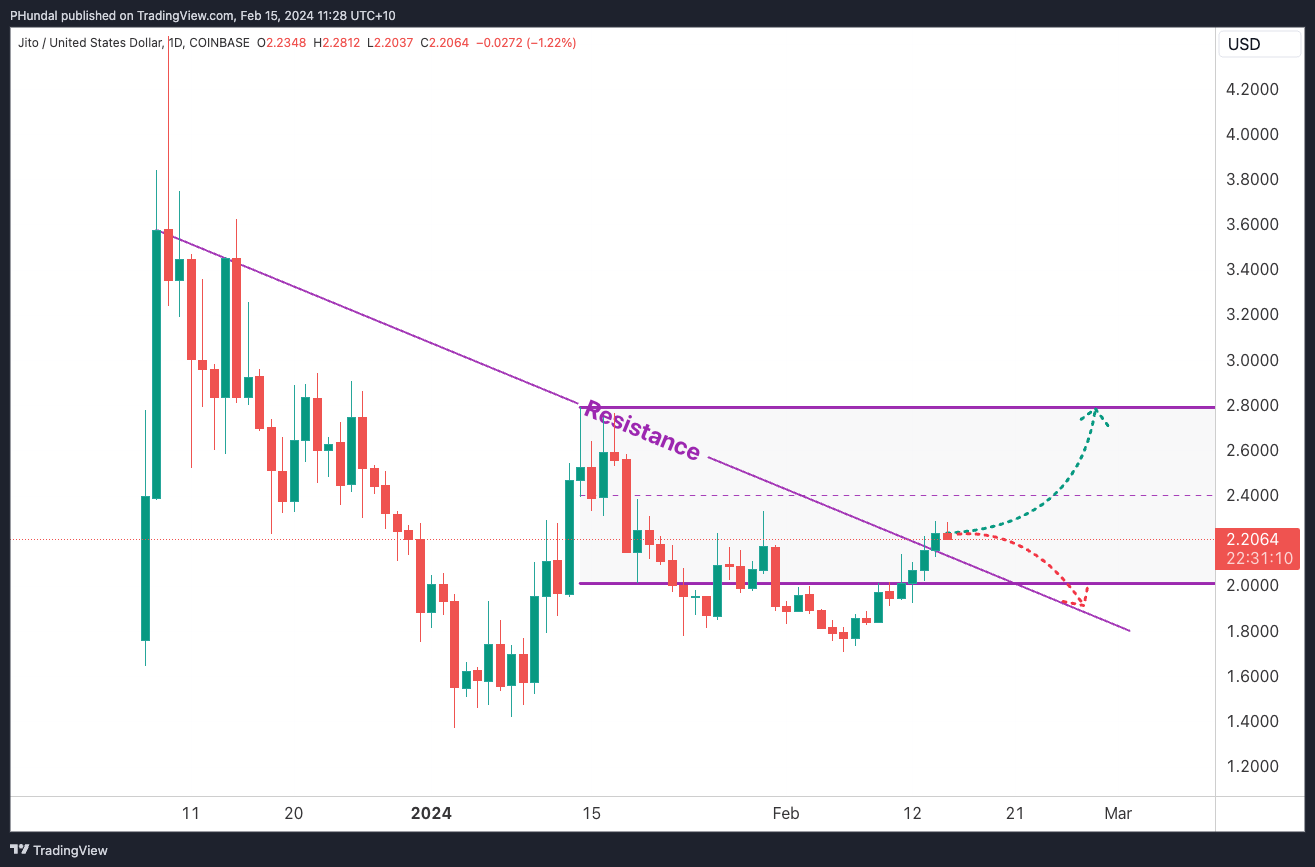
Looking at the technical structure of JTO, it has breached a key level of resistance when drawing a trendline off the daily closes from prior pivot highs. Below are two scenarios based on market structure.
Bullish scenario
A move higher after this breakout towards the previous prior high. This is an approximate 25% move from the time of writing. Once this level is reached, the market may or may not continue high pending underlying conditions.
Bearish scenario
Not enough interest in this breakout, which could result in a retest along this current key resistance level. Should buyers not step in at any stage, we could see prices break below the critical resistance level which we just broke.
Disclaimer: The information on Swyftx Learn is for general educational purposes only and should not be taken as investment advice, personal recommendation, or an offer of, or solicitation to, buy or sell any assets. It has been prepared without regard to any particular investment objectives or financial situation and does not purport to cover any legal or regulatory requirements. Customers are encouraged to do their own independent research and seek professional advice. Swyftx makes no representation and assumes no liability as to the accuracy or completeness of the content. Any references to past performance are not, and should not be taken as a reliable indicator of future results. Make sure you understand the risks involved in trading before committing any capital. Never risk more than you are prepared to lose. Consider our Terms of Use and Risk Disclosure Statement for more details.