
Key takeways
- Bitcoin teases an all-time high overnight as Bitcoin Exchange Traded Funds (ETFs) smash records again in the US.
- Bullish and bearish sentiment from the ETF might be a key part of understanding when this rally may slow.
- Technical analysis for Solana, Avalanche. Mapping out technical targets.
Bitcoin ETF Hits Sets New Records
US Bitcoin Exchange Traded Funds (ETFs) continue to provide fundamental tailwinds in favour of the bulls.
As an interesting data point, in the last seven days we’ve seen just over 2,000 million USD in net buying activity on Bitcoin from these entities in the US. And the momentum doesn’t look like it’s slowing, with the 27th of February producing the largest day of buying from the BlackRock IBIT Bitcoin ETF.
While this has been positive to see, it’s also important to speculate what could be the implications on the market if these flows slow down? I share my thoughts below.
Bitcoin – BTC
Bitcoin continuing to hammer higher towards a breakout. For a full breakdown of bullish and bearish scenarios, check out my latest video. Where I did cover looking at option books data, which showed $60,000-$65,000 as important figures.
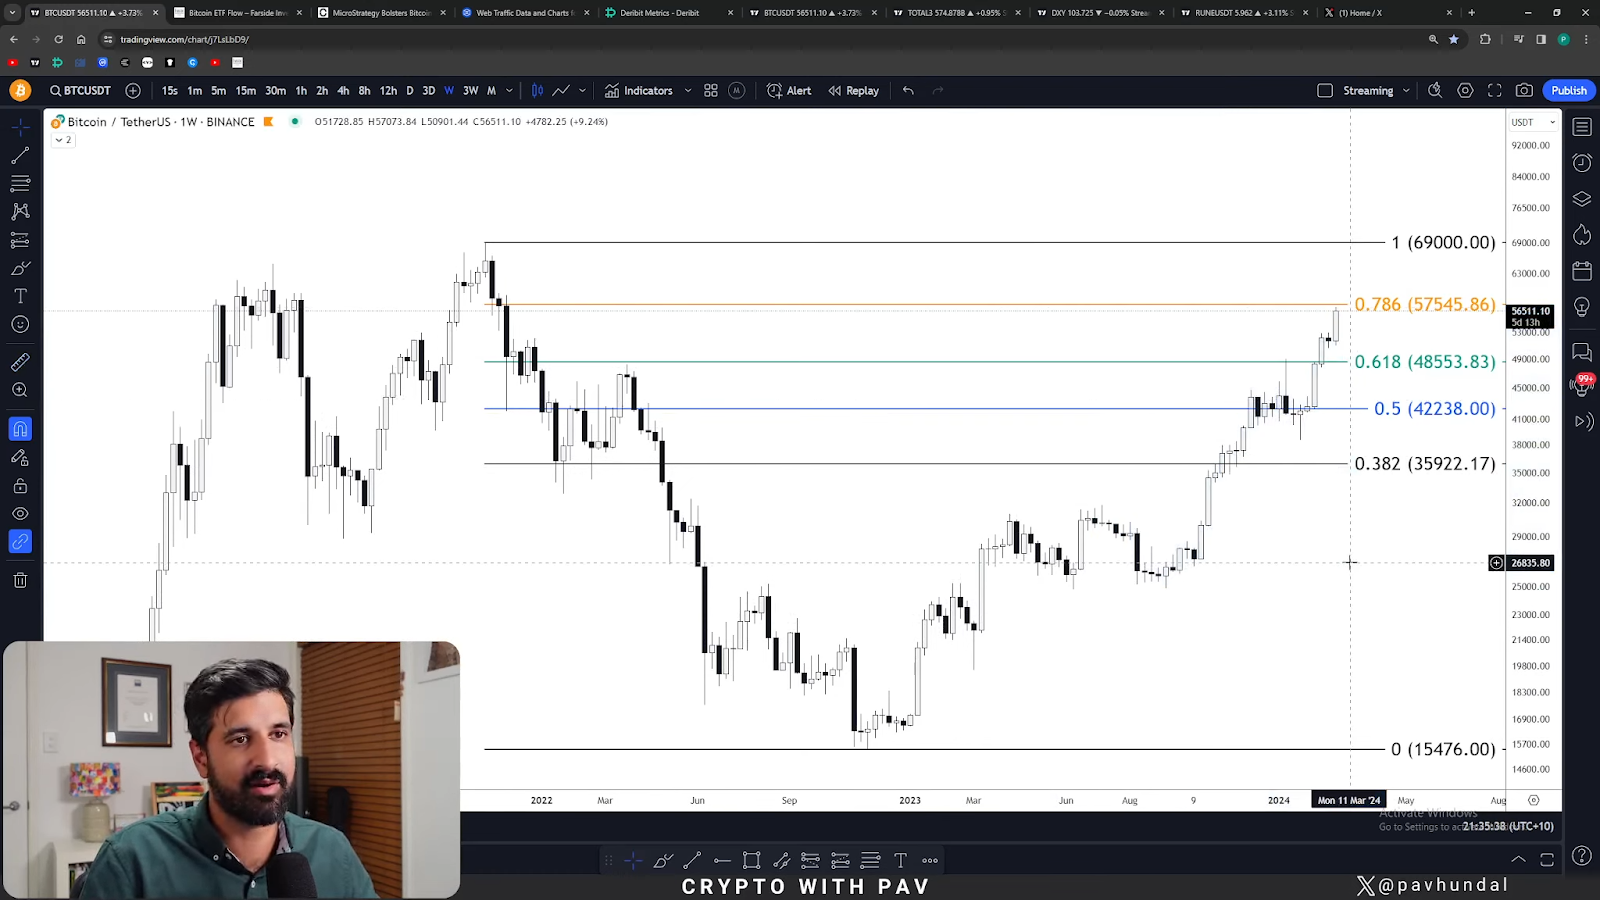
Source: YouTube – Crypto with Pav
Weighing up the market from where we stand is difficult as it seems the ETF may be driving sentiment in the market at this time. This time, from a fundamental perspective, here are two scenarios I would be watching regarding ETF flows moving forward.
Bullish scenario
ETF flows remain net buying, and the total volume of Bitcoin ETFs traded daily sustains its current momentum.
Bearish scenario
Should the ETF flows go neutral or turn net selling, and daily trade volumes remain high, this could be the first sign that the bulls may be taking profits.
Solana – SOL
A top performer among the higher cap altcoins, Solana is forming some technical structure that is of interest. Notably after the recent move on Bitcoin, Solana has broken a range of consolidation. Below are two potential scenarios from here based on market structure analysis.
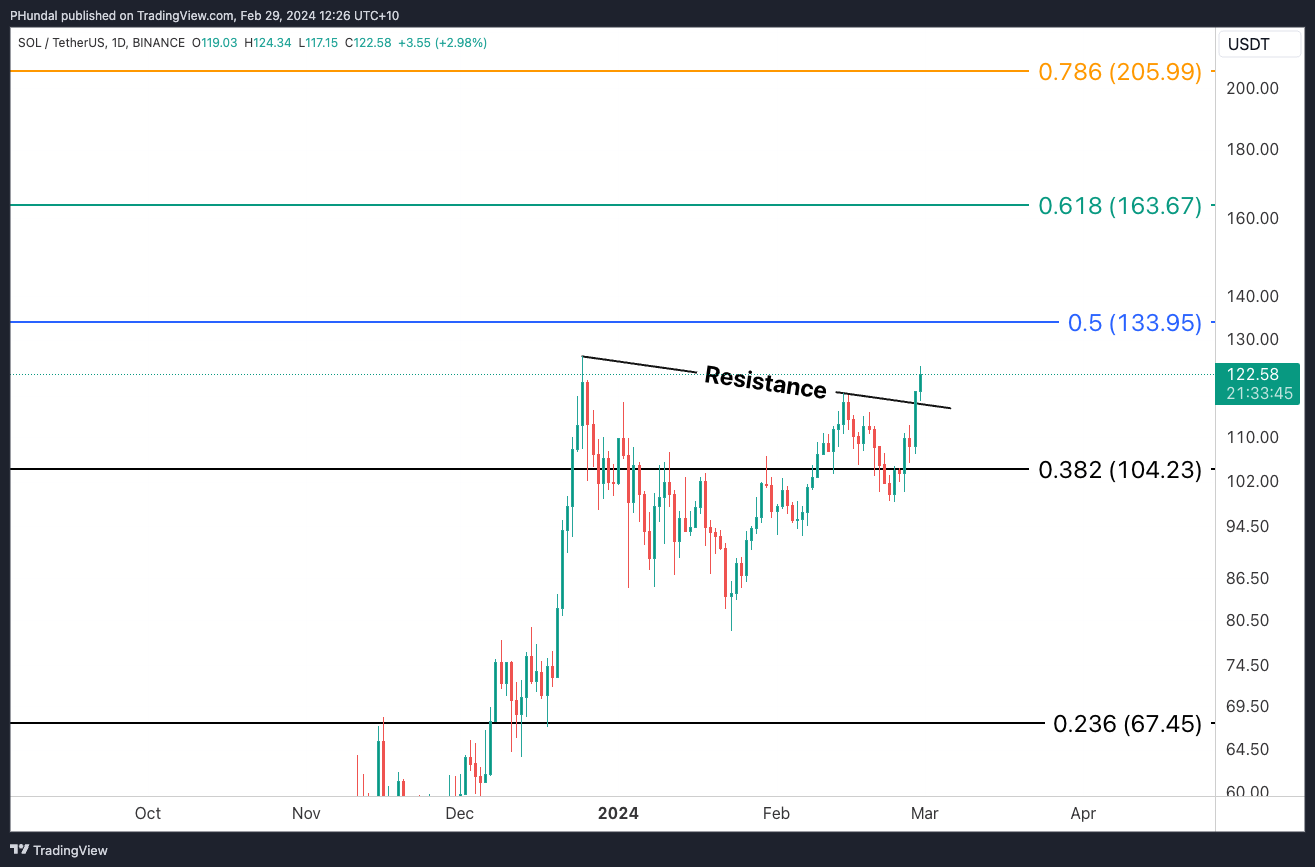
Source: TradingView
Bullish scenario
Bulls continue to drive the price of Solana higher, with the next technical Fibonacci levels being the 0.5 ($133.95 USD), 0.618 ($163.67 USD) and the 0.786 ($205.99 USD).
Bearish scenario
Failure to maintain momentum and bids behind this move, resulting in the move lower beyond the current lows of $99 USD.
Avalanche – AVAX
Avalanche also offers a similar technical structure to Solana, however could be considered as a laggard. They are both infrastructure tokens amongst the top 10 assets.
Looking at a weekly candlestick chart of Avalanche, there are notable technical Fibonacci levels above current price. Similar to Solana, looking at technical Fibonacci levels above price we can map out some potential scenarios.
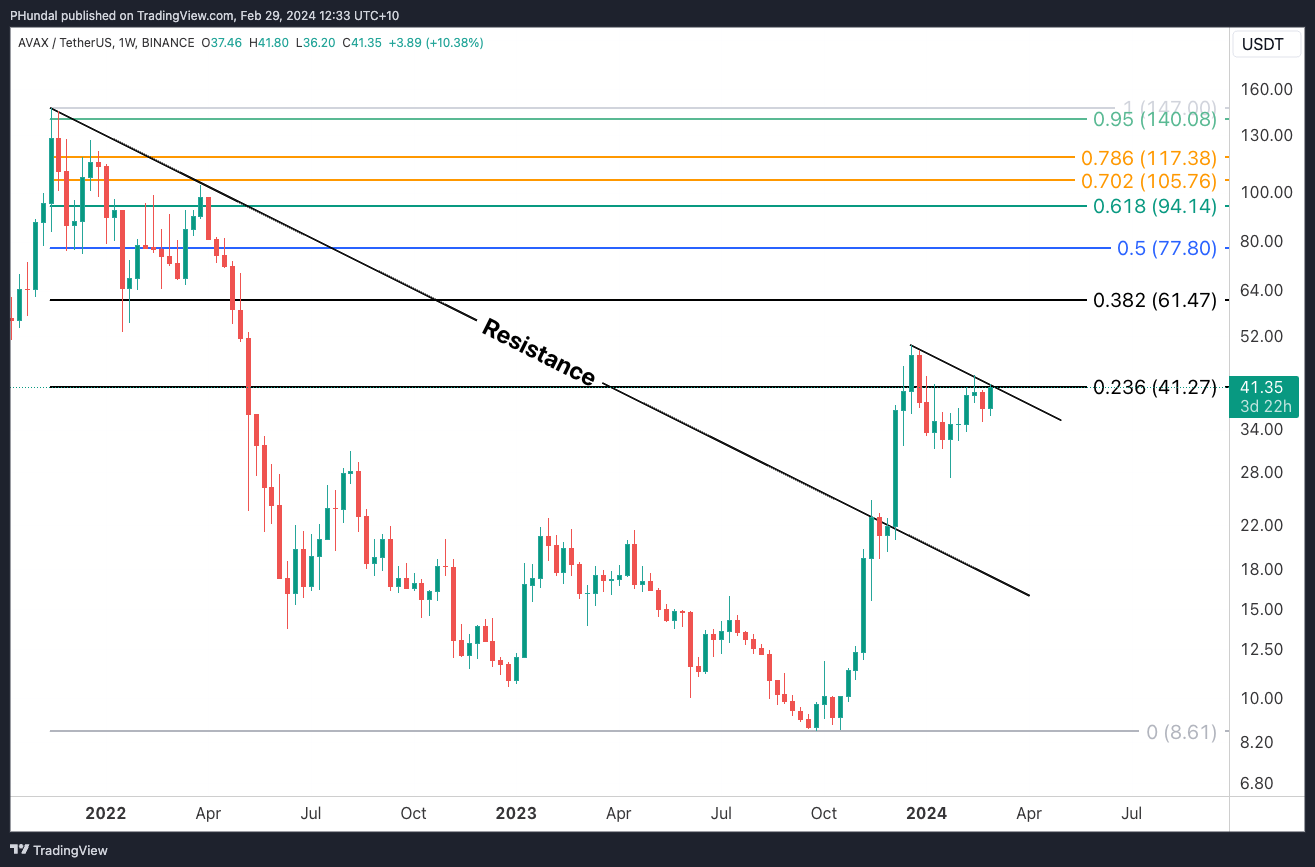
Source: TradingView
Bullish scenario
A breakout of this current range, with the technical Fibonacci levels above of interest being the 0.382 ($61.47 USD), 0.50 ($77.80 USD) and the 0.618 ($94.14 USD)
Bearish scenario
Failure to break out of this current weekly range, could see prices move lower to previous weekly lows starting at $35.20 USD.
Disclaimer: The information on Swyftx Learn is for general educational purposes only and should not be taken as investment advice, personal recommendation, or an offer of, or solicitation to, buy or sell any assets. It has been prepared without regard to any particular investment objectives or financial situation and does not purport to cover any legal or regulatory requirements. Customers are encouraged to do their own independent research and seek professional advice. Swyftx makes no representation and assumes no liability as to the accuracy or completeness of the content. Any references to past performance are not, and should not be taken as a reliable indicator of future results. Make sure you understand the risks involved in trading before committing any capital. Never risk more than you are prepared to lose. Consider our Terms of Use and Risk Disclosure Statement for more details.