
Bitcoin fundamental analysis
BlackRock has updated their ETF application with recommended amendments around Custodial duties from Coinbase.
Related: Blackrocks proposed Bitcoin ETF
There has been a constant stream of BTC spot ETF applications being submitted ever since BlackRock, one of the world’s largest asset managers, submitted their application last month. Prominent players like WisdomTree, Invesco Galaxy, Valkyrie Investments, and Ark Invest have all joined the race.
This surge of applications reflects a remarkably positive shift in the fundamental landscape for Bitcoin, something that hasn’t been witnessed in quite some time. However, it remains to be seen whether the SEC will allow any of these ETFs, having previously rejected numerous ETFs.
Bitcoin halving countdown
What’s also important to remember is the Bitcoin halving is now officially less than a year away. Historically, the price of Bitcoin has previously surged around a halving event. However, the global economy is in a vastly different position this coming halving, and it’s important to keep in mind that past performance is not indicative of future performance.
Number of Bitcoin HODLers is at an all-time high
The following charts depicts the correlation between BTC’s price and the number of Bitcoin held by HODLers in the market. In this case, a HODLer is categorised as a wallet that has held Bitcoin for long than 12 months.
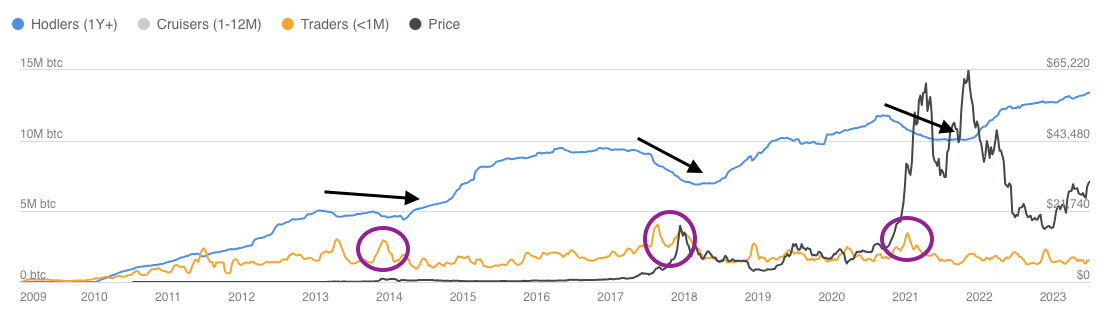
Figure 1: Bitcoin HODLers. Source Swyftx Analytics.
From a histroical perspective, HODLers have typically reduced their holdings (indicated by black arrows) towards the end of a bull run, while traders eagerly entered the market to make purchases (depicted by purple circles). This pattern was seen during the bull Bitcoin bull runs in 2013, as well as in late 2017 and 2021. Subsequently, a few months after HODLers start increasing their balance, the inception of a new bull cycle tends to emerge.
At is stands, the number of BTC held by HODLers is at an all-time high and is consistently rising, as more fall into the HODLer category.
You can get more Bitcoin data like this here.
Bitcoin technical analysis
The king of crypto has been on the move lately, up 16% in the last fortnight. For those interested in technical analysis, Bitcoin has closed the month of June creating a Bullish Engulfing candle.

Figure 2: This image is an example what a bullish engulfing candle looks like.
Technically, this can indicate trend continuation, suggesting that the current trend for Bitcoin will continue in July. However, it is not suggested that this is destined to occur – see the both scenarios below.
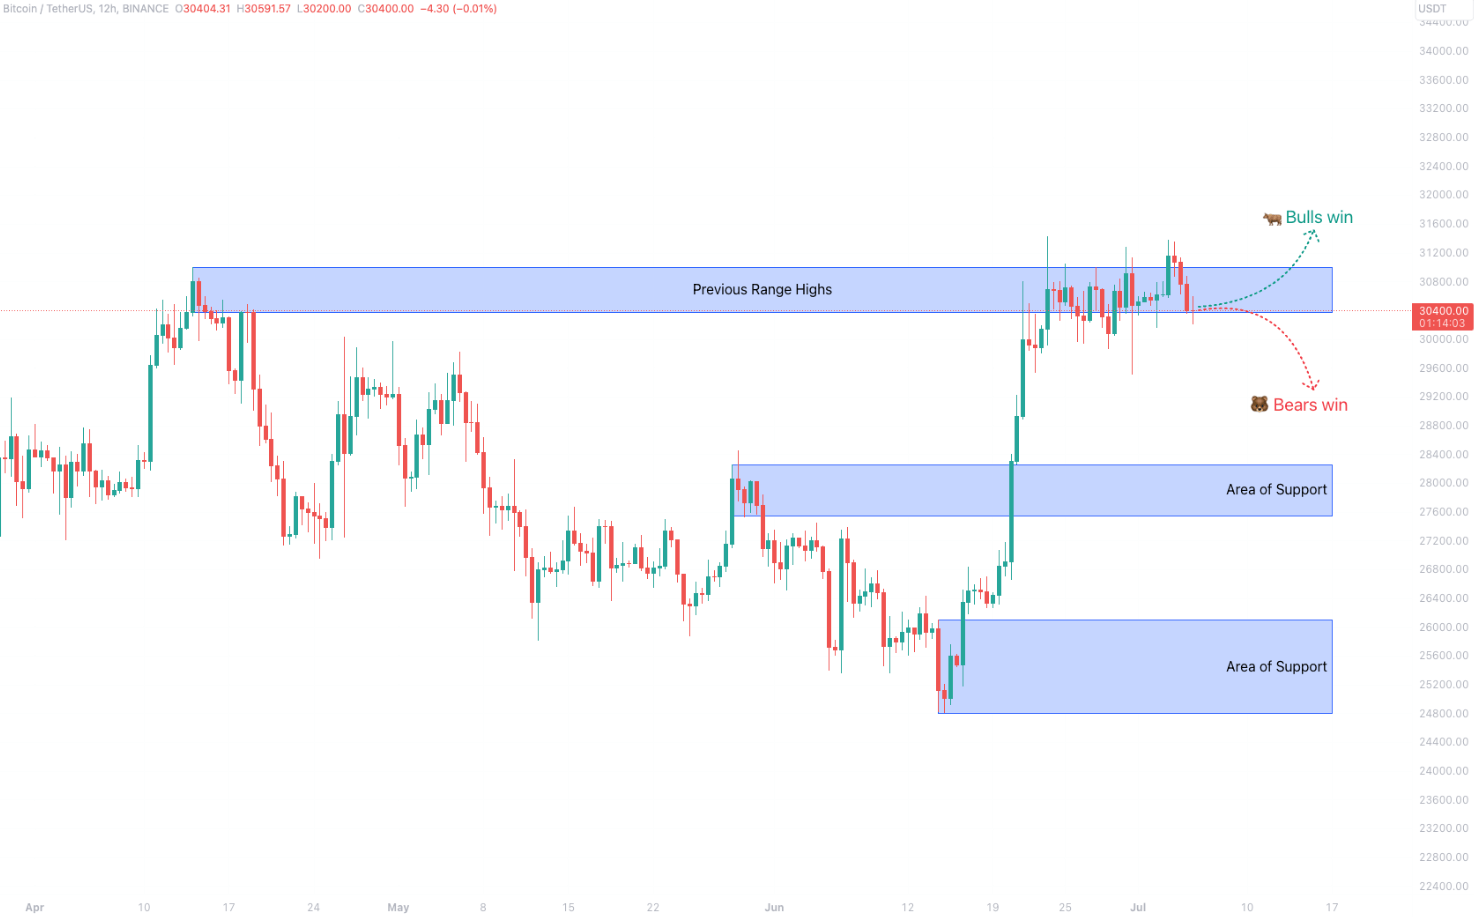
Figure 3: Bitcoin support levels. Source TradingView.
Price is currently at a decision point. We wait cautiously to see who’s going to be in charge – will it be the bulls or the bears?
🐂 Bullish Scenario
From here we want to see the current structure hold, and no new lower lows develop. A higher high above the current monthly high, which is also the yearly high will be good news for the bulls.
🐻 Bearish Scenario
Should price fail to hold this area, we would then wait to see if price has a reaction at the below significant areas of structure. Time will only tell if we do head down, if these levels hold or of price would indeed drop below $25,000 USD.
Disclaimer: The information on Swyftx Learn is for general educational purposes only and should not be taken as investment advice, personal recommendation, or an offer of, or solicitation to, buy or sell any assets. It has been prepared without regard to any particular investment objectives or financial situation and does not purport to cover any legal or regulatory requirements. Customers are encouraged to do their own independent research and seek professional advice. Swyftx makes no representation and assumes no liability as to the accuracy or completeness of the content. Any references to past performance are not, and should not be taken as a reliable indicator of future results. Make sure you understand the risks involved in trading before committing any capital. Never risk more than you are prepared to lose. Consider our Terms of Use and Risk Disclosure Statement for more details.