Key Takeaways
- 3 US banks have fallen within the space of a week
- The US government have assured that customers of the banks will have access to their funds.
- President Biden addressed the public with a mitigation plan to avoid a 1930’s style event
- Goldman Sachs analysts anticipate the Fed will not increase interest rates given the situation playing out
7-day market recap
In the last 5 days, we’ve seen unfold America’s second-largest banking failure. Despite this, Bitcoin has continued to move higher, overnight breaking $26,000 USD.
So, what happened? Well, without going into too much detail Silvergate, Silicon Valley Bank (SVB) and Signature Bank have all fallen. This was partly due to the current economic climate impacting their treasury investment portfolios.
It’s common practice for banks to take client funds and invest them in long term investment instruments like government bonds. In the example of SVB, they held billions in treasury bonds. Yields on bonds have been on the rise in recent times. However, SVB’s bond contracts were to the value of previously issued bonds, paying lower interest rates. Next came a crunch, and the SVB needed to convert these long-term investment bonds to cash which resulted in a $1.8bn USD loss.
What happened next? The US Federal Government has intervened and assured the customers of the failed banks that their funds will be available.
“Your deposits will be there when you need them,” President Joe Biden.
The US Government’s key concerns are to avoid a 1930’s style bank run, and a stock market crash. Bank stocks in the US plummeted $90bn in market value on Monday. President Biden has promised to do ‘whatever is needed’ to avoid any freefall event.
It’s still yet to be seen what further contagion risks exist right now. But the overall theme is the banks’ have failed to mitigate their risks, and the US taxpayer is there to pull them out.
Source: Reuters.com
Market outlook
So, the subject everyone is talking about right now, what will happen at the US interest rates meeting next week. Again, this can be dry and boring to keep talking about. But the fact that the expectations for a rate increase has now dropped dramatically, is a potential key catalyst for why crypto markets are running hot right now.
Goldman analysts are even going as far to expect no Fed rate hike rise, given the fragility of the banking failure currently unfolding in the US.
These meetings have drawn time and time again two things, volatility and sentiment as to where investors choose to deploy capital.
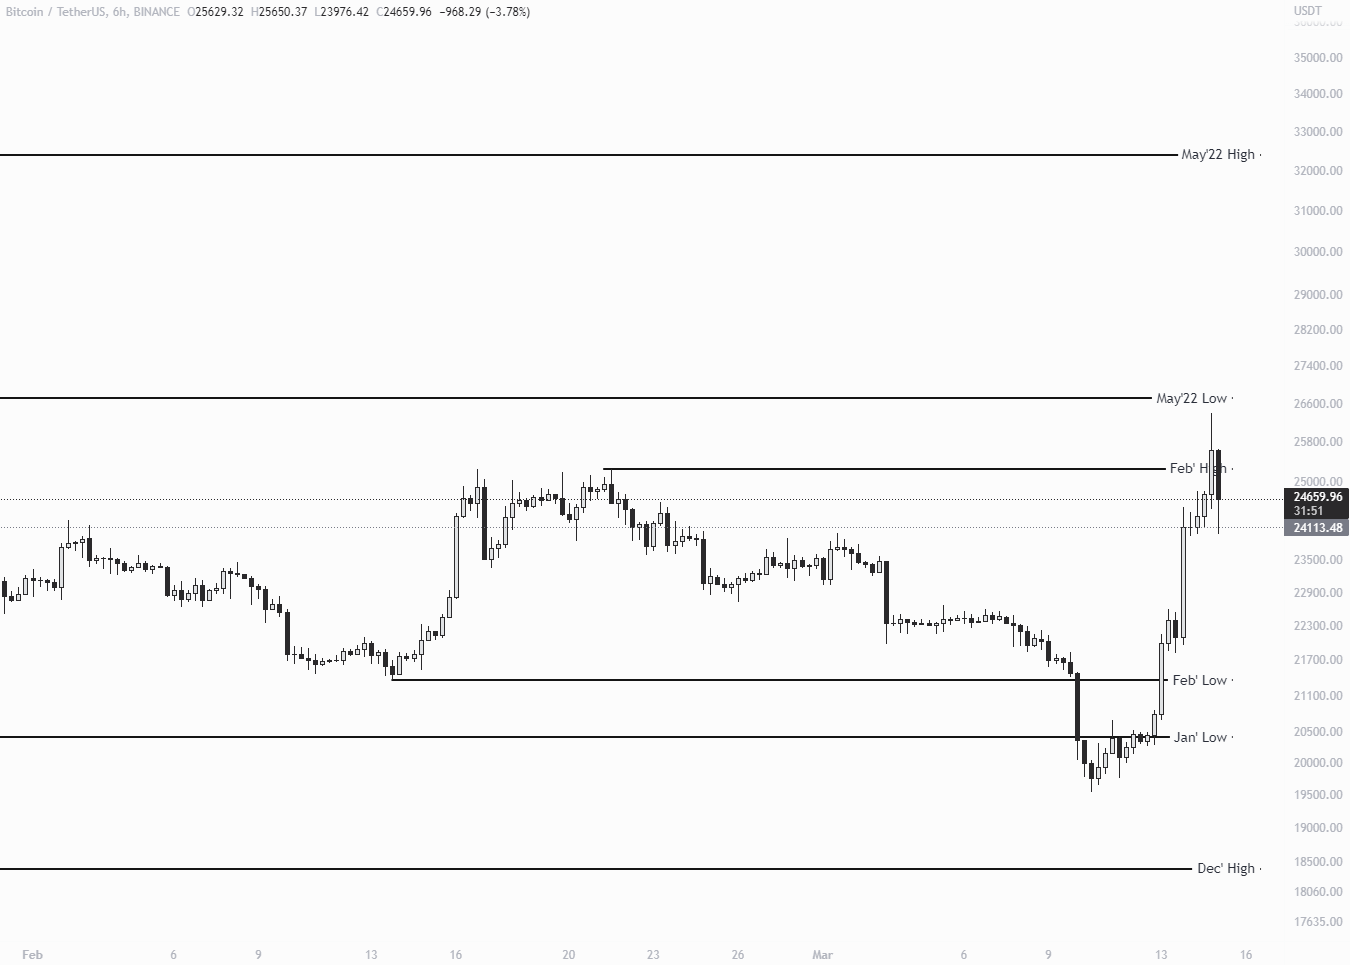
Looking at the charts we can look at some potential scenarios 👇.
Bullish Scenario: The current BTC price has broken the February high, this happened after the Consumer Price Index (CPI) data print from the US came in as expected. A very violent move. If market was to continue making higher lows and higher highs, the monthly high and low from May last year could be levels to watch. This is a price range of ~USD $26,500 to $32,000.
Bearish Scenario: Having now breached the February high, there is a chance that we fail to hold. This would be seen as price making lower lows, and then a respective lower high. Such market structure could result in price falling away and looking to move to the downside until support is found.
Coin Watch – Ethereum (ETH)
The unlock
The Ethereum Shanghai network upgrade is slated for April and will allow those staking their ETH on the network to withdraw their assets.
This is quite a big milestone for the project, and the context of what impact this has had on Ethereum’s circulating supply and price is worth breaking down.
Currently, 17 million ETH are locked up in the ETH staking pools. This equates to 14% of the total current supply unavailable to be traded. There is also approximately 5.8 million ETH locked up in defi protocols (4.8%). This equates to almost 20% of ETH that is currently not tradable and will become available for trading in April.
Supply changes – move to Proof of Stake now deflationary
The graphic below compares Ethereum’s circulating supply since merging from Proof of Work to Proof of Stake. This is compared to Bitcoin’s circulating supply and ETH’s simulated Proof of Work supply for the period.
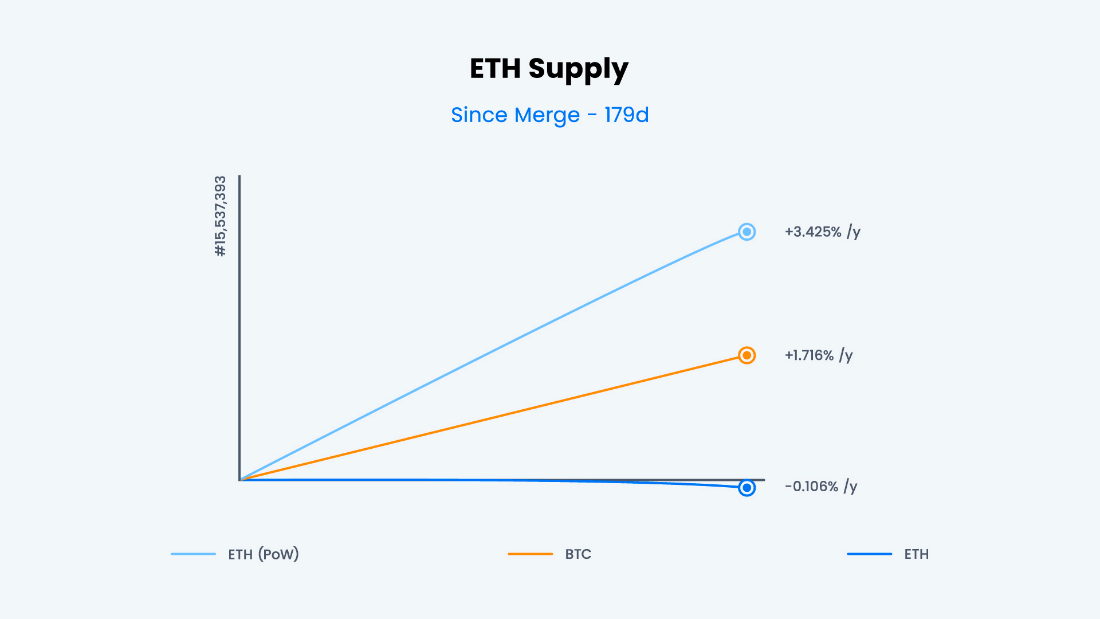
Figure 2: ETH Supply. Source Ultrasound Money.
The blue line is the current modelling since the asset converted to PoS. Ethereum is currently on a deflationary trajectory, with an annual growth of -0.106% projected. This is possible due to one of the other recent upgrades to the network, allowing ETH to be burnt/destroyed upon each network transaction.
The significance of this is quite simple, price is based on supply and demand. Having lower supply is a factor for growth when combined with high demand.
Potential Price Impacts
The supply and demand balance of Ethereum is about to change, with potentially 14% more ETH able to be sold in April. However, this event may not mean that ETH stakers will be in a rush to sell given the majority are not in profit and the high yields available with staking. That being said, some of the ETH has been locked up since 2020. There is much speculation about whether these early adopters will sell or retain their ETH.
Ultimately, it seems that it will be a mixed bag. Some early adopters may choose to continue to support the PoS consensus, rather than take immediate profits (or losses). I suspect price to be impacted by this locked supply with any volatility that comes to the market. Less supply and any swings in demand may result in price delivery we have not previously observed for Ethereum prior to the merge.
Disclaimer: The information on Swyftx Learn is for general educational purposes only and should not be taken as investment advice, personal recommendation, or an offer of, or solicitation to, buy or sell any assets. It has been prepared without regard to any particular investment objectives or financial situation and does not purport to cover any legal or regulatory requirements. Customers are encouraged to do their own independent research and seek professional advice. Swyftx makes no representation and assumes no liability as to the accuracy or completeness of the content. Any references to past performance are not, and should not be taken as a reliable indicator of future results. Make sure you understand the risks involved in trading before committing any capital. Never risk more than you are prepared to lose. Consider our Terms of Use and Risk Disclosure Statement for more details.