Key Takeaways
- Measuring public interest across major news events in 2025, and how that could be impacting crypto markets.
- Options data currently shows a segment of the market expecting higher prices on Bitcoin.
- Chart of the week:
Bitcoin Volatility Index at 18-month lows
Trying to make sense of the last seven days in crypto has a real ‘red pill vs blue pill’ vibe.
This week was another turbulent one for crypto markets. Conflict escalation in the Middle East has added another obstacle for investors to navigate.
But at the same time – it’s not all bad, the U.S. Senate has passed the landmark GENIUS Act, marking a historic moment for the industry where basic rules for stablecoin are now known.
When we step back and try to figure out where things are heading as investors, how do we make sense of all this noise? On one hand, we’re seeing one of the biggest fundamental breakthroughs for crypto to date. On the other, there are fears of a global conflict where we’re all left in the lurch of what could happen next.
It’s times like this where we can look at some data to understand how the market is reacting.
Global influences
Below we will use Google Trends to track and visualise how interested the public is across headlines we’ve seen in the last three months.
The data below shows global interest in tensions in the Middle East spilling over has captured more attention than the trade war did. Today’s headline risks are far wider reaching, and likely more emotionally charged, than what we saw earlier this year.
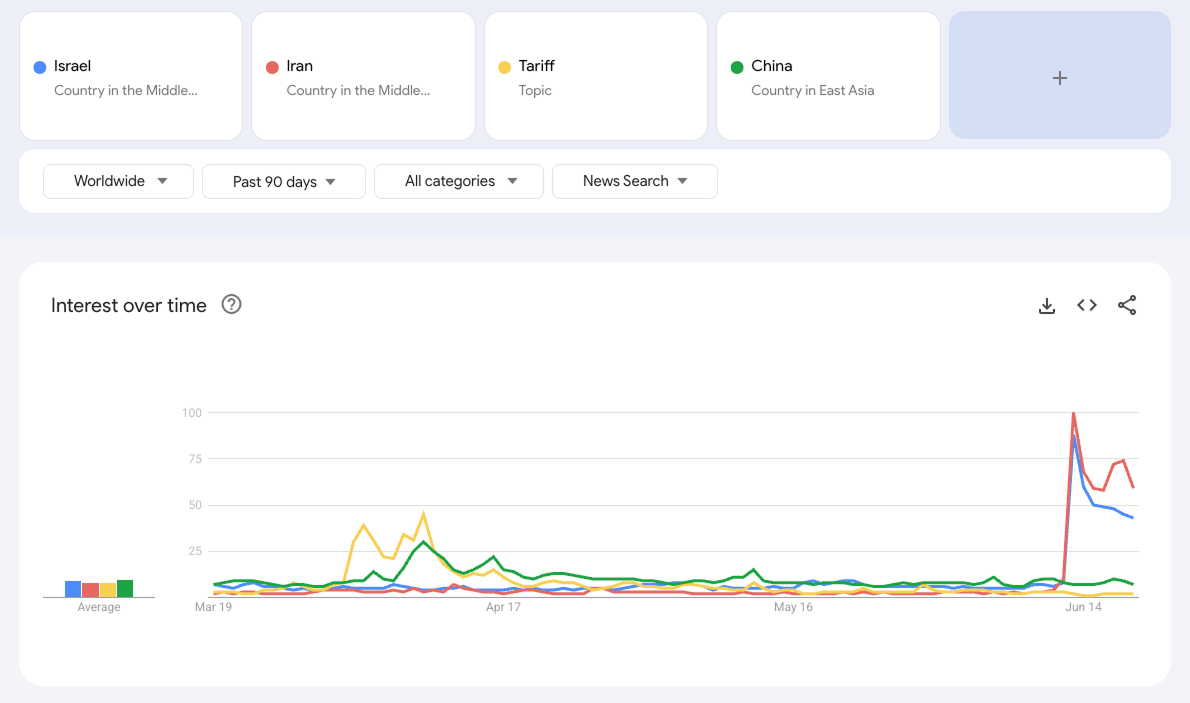
From this, we can infer that the situation in the Middle East is seen as a much more serious and immediate global risk, drawing strong public attention. This heightened focus feeds into market sentiment and could be driving a reduced appetite for investing or risk-taking in crypto markets.
Thinking a step ahead, it means that any new developments (or surprises) from here are likely to have a bigger impact on investor behaviour.
Option market positioning data
Option markets can provide another layer of understanding in what traders and investors are expecting. Option markets are complex and therefore participants can be characterised as more sophisticated. The below chart gives us a sense of what these investors/traders expect for Bitcoin over different time horizons.
Essentially, it shows whether more traders are anticipating prices going up (buying call options) or down (buying put options). When the lines are above zero, it means more people are buying calls – they expect Bitcoin to rise. When the lines are below zero, it means more people are buying puts – suggesting concern about prices falling.
A 25-delta reading on an option means there’s roughly a 25% chance that the option will expire profitable, based on current market conditions.
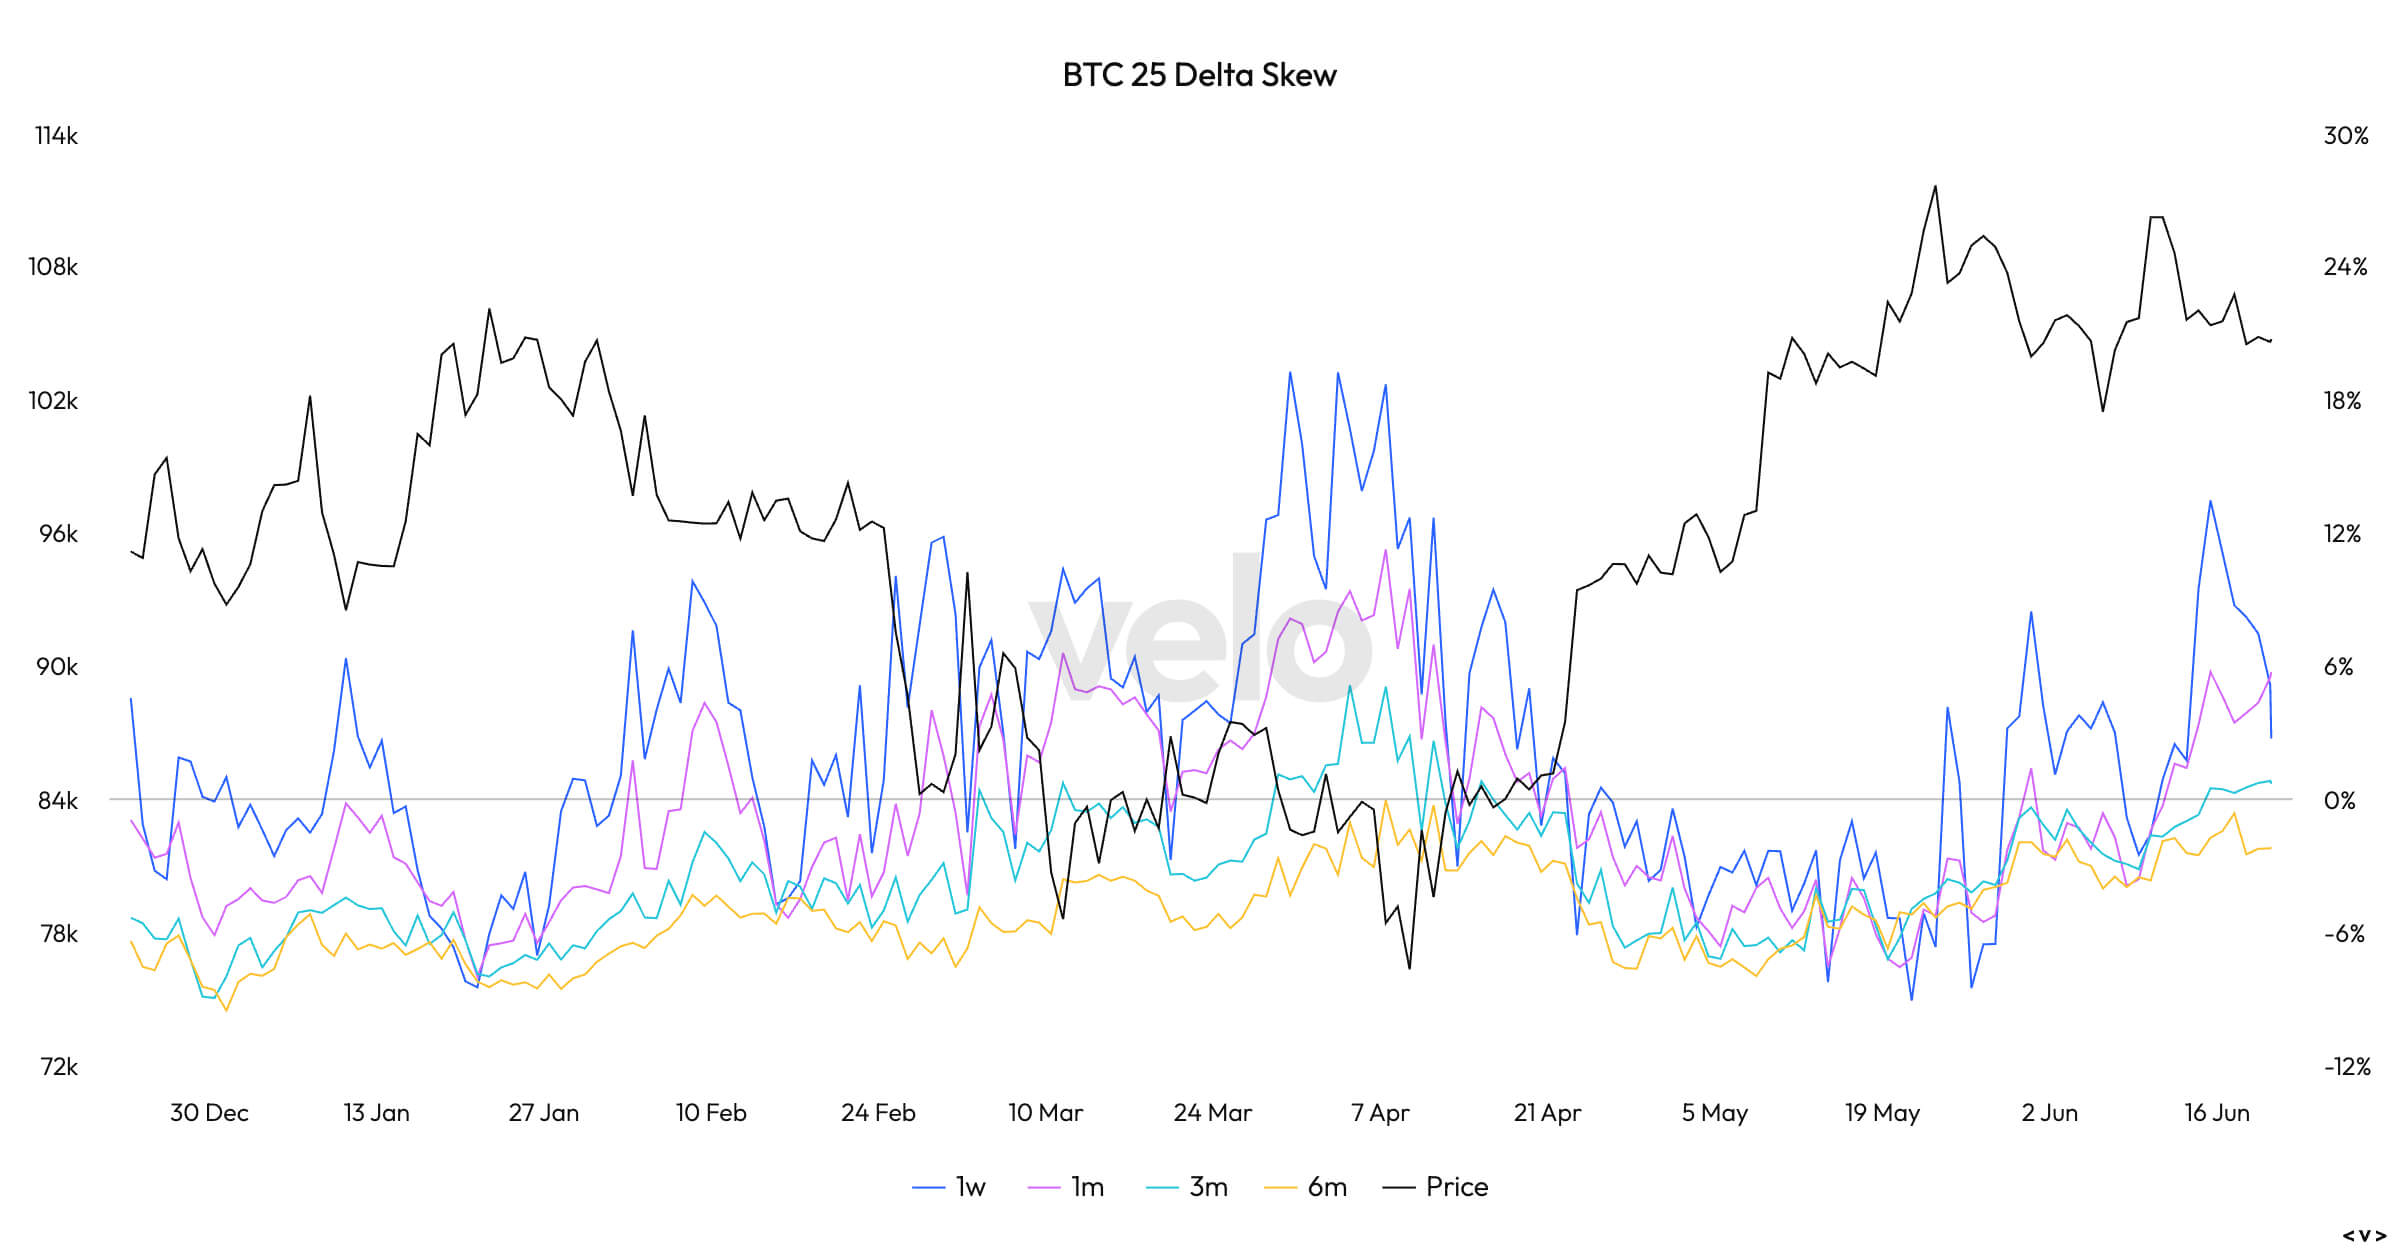
The insight we can take away from looking at the data, is that since June the skew has been trending higher – meaning the preference for the market has been, in recent times, in favour of bulls.
These traders are expecting a potentially large move to the upside. You could view this as a step outside the crowd.
This data is interesting and insightful when you think about the news search trends I spoke about above. Perhaps this is a segment of the market that sees the current conflict as more of a short-term bump than a long-term problem.
So…if there is a chance the global conflict risks are short-term, does that mean we could see a segment of the market on the wrong side? And what would that look like?
This is where looking at historic volatility trends might shed some light.
Chart of the week – Bitcoin Volatility Index at 18-month lows
The Bitcoin Volatility Index (DVOL), as measured by Deribit, shows how much Bitcoin’s price is expected to move over the next 30 days based on current option prices. It doesn’t predict whether the market will go up or down, but it serves as a kind of “fear and greed” gauge.
When DVOL spikes, it often signals that traders — both bulls and bears — are repositioning in response to a new catalyst. Since those catalysts can be either positive or negative, the index reflects shifts in both fear and excitement in the market.
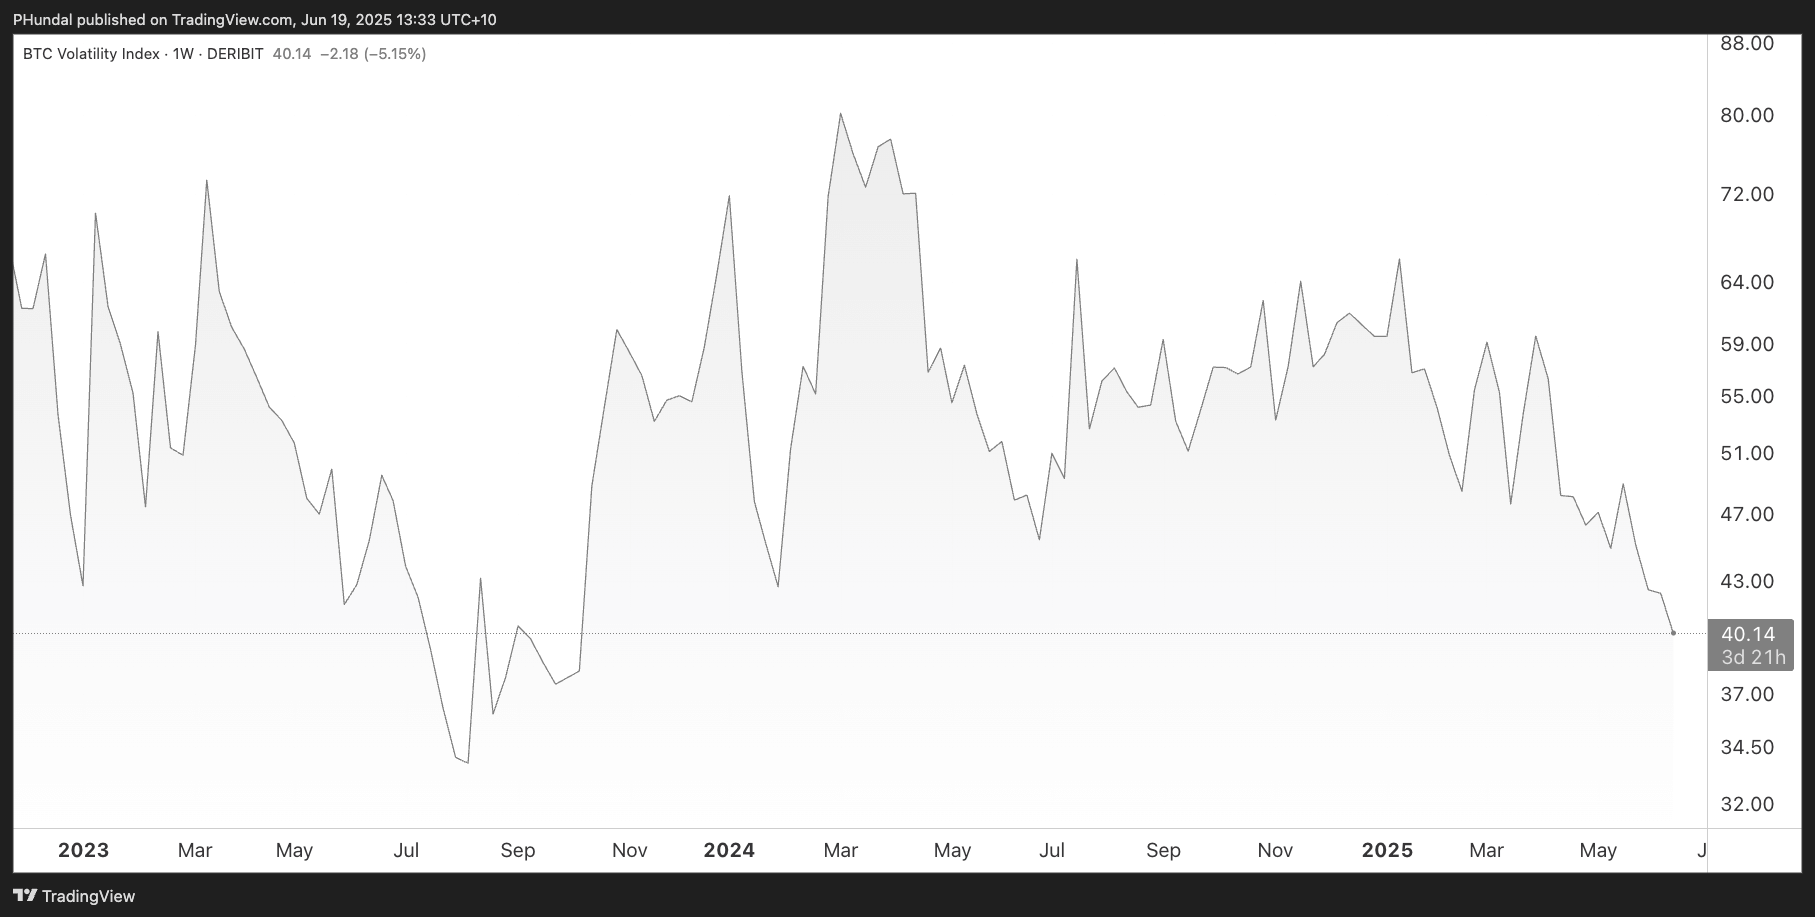
DVOL is now sitting at ~40, which is among the lowest levels we’ve seen in the past 18 months. This tells us traders are pricing in very limited movement in Bitcoin over the next 30 days.
Low volatility isn’t a signal that nothing will happen – it can be a signal that traders are under-pricing potential catalysts.
So, as we’ve seen, eyes and ears currently glued to the Middle East conflict. The data has set the stage for a scenario where, if these tensions ease and global leaders step back from escalation, markets could quickly shift.
💱 Swyftx Flows
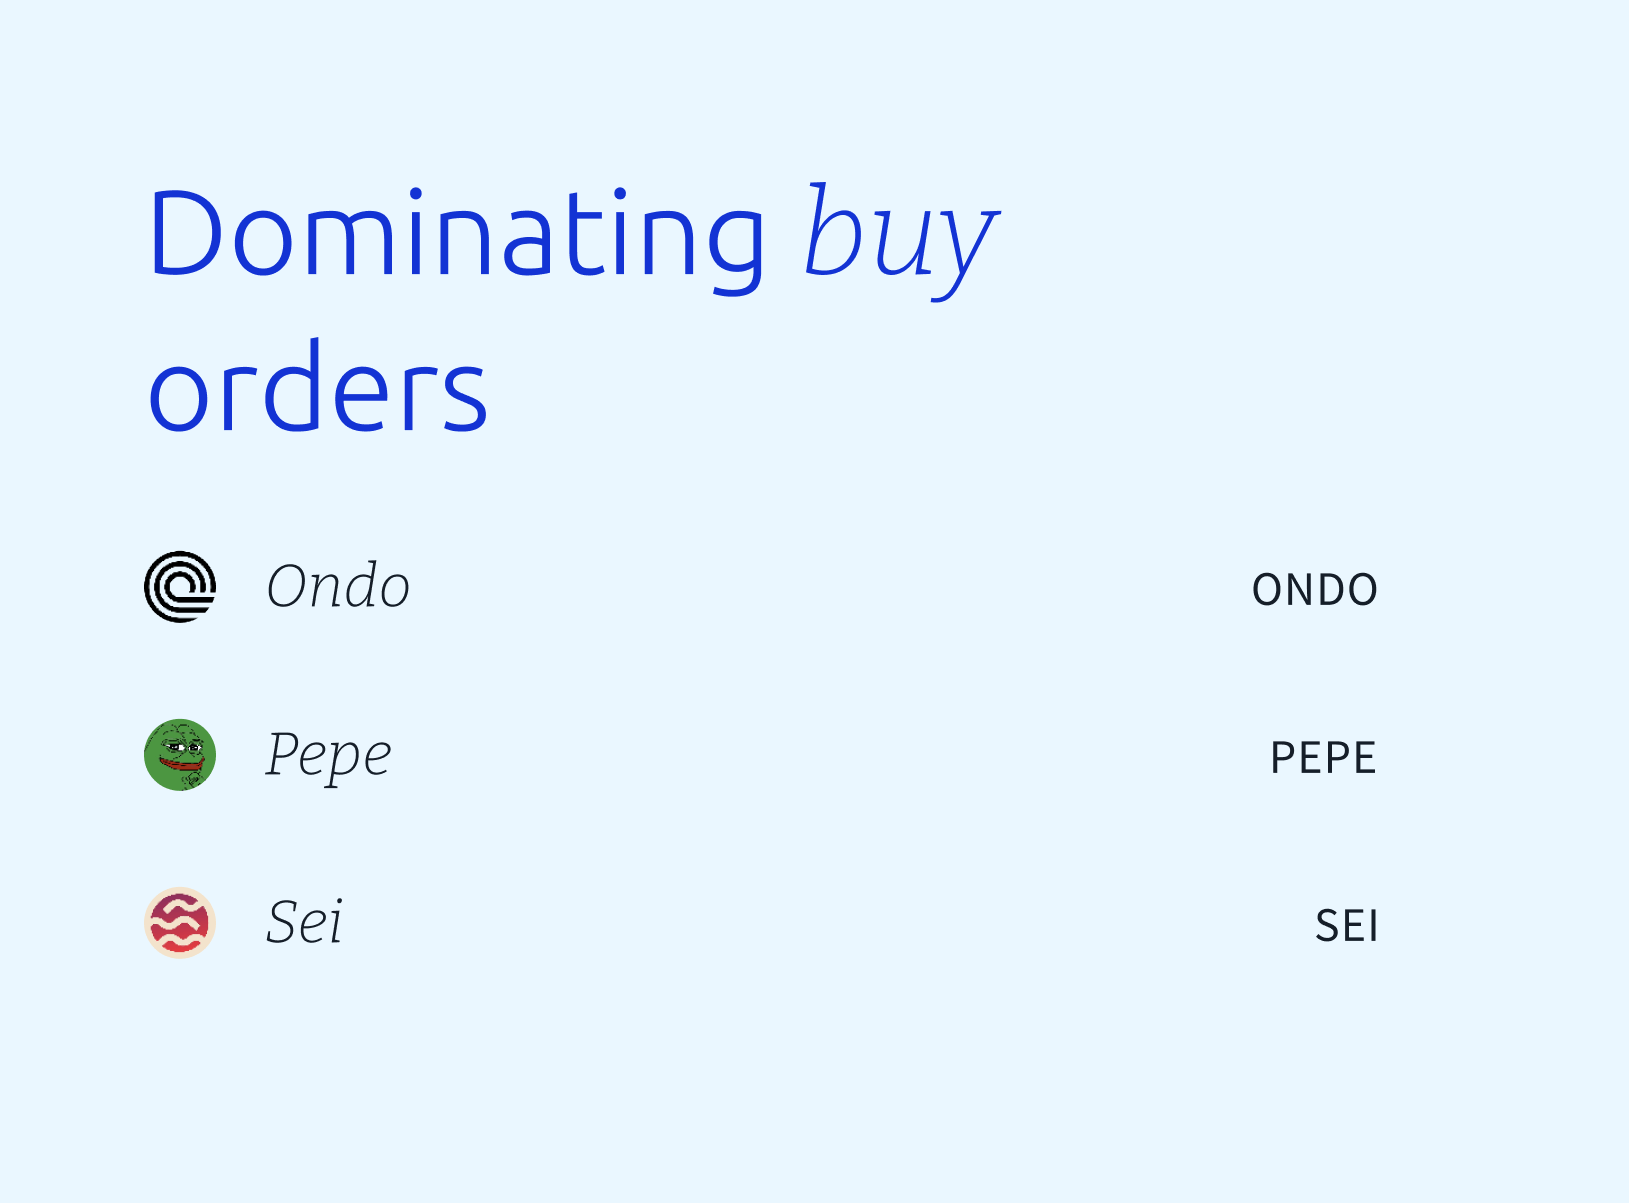
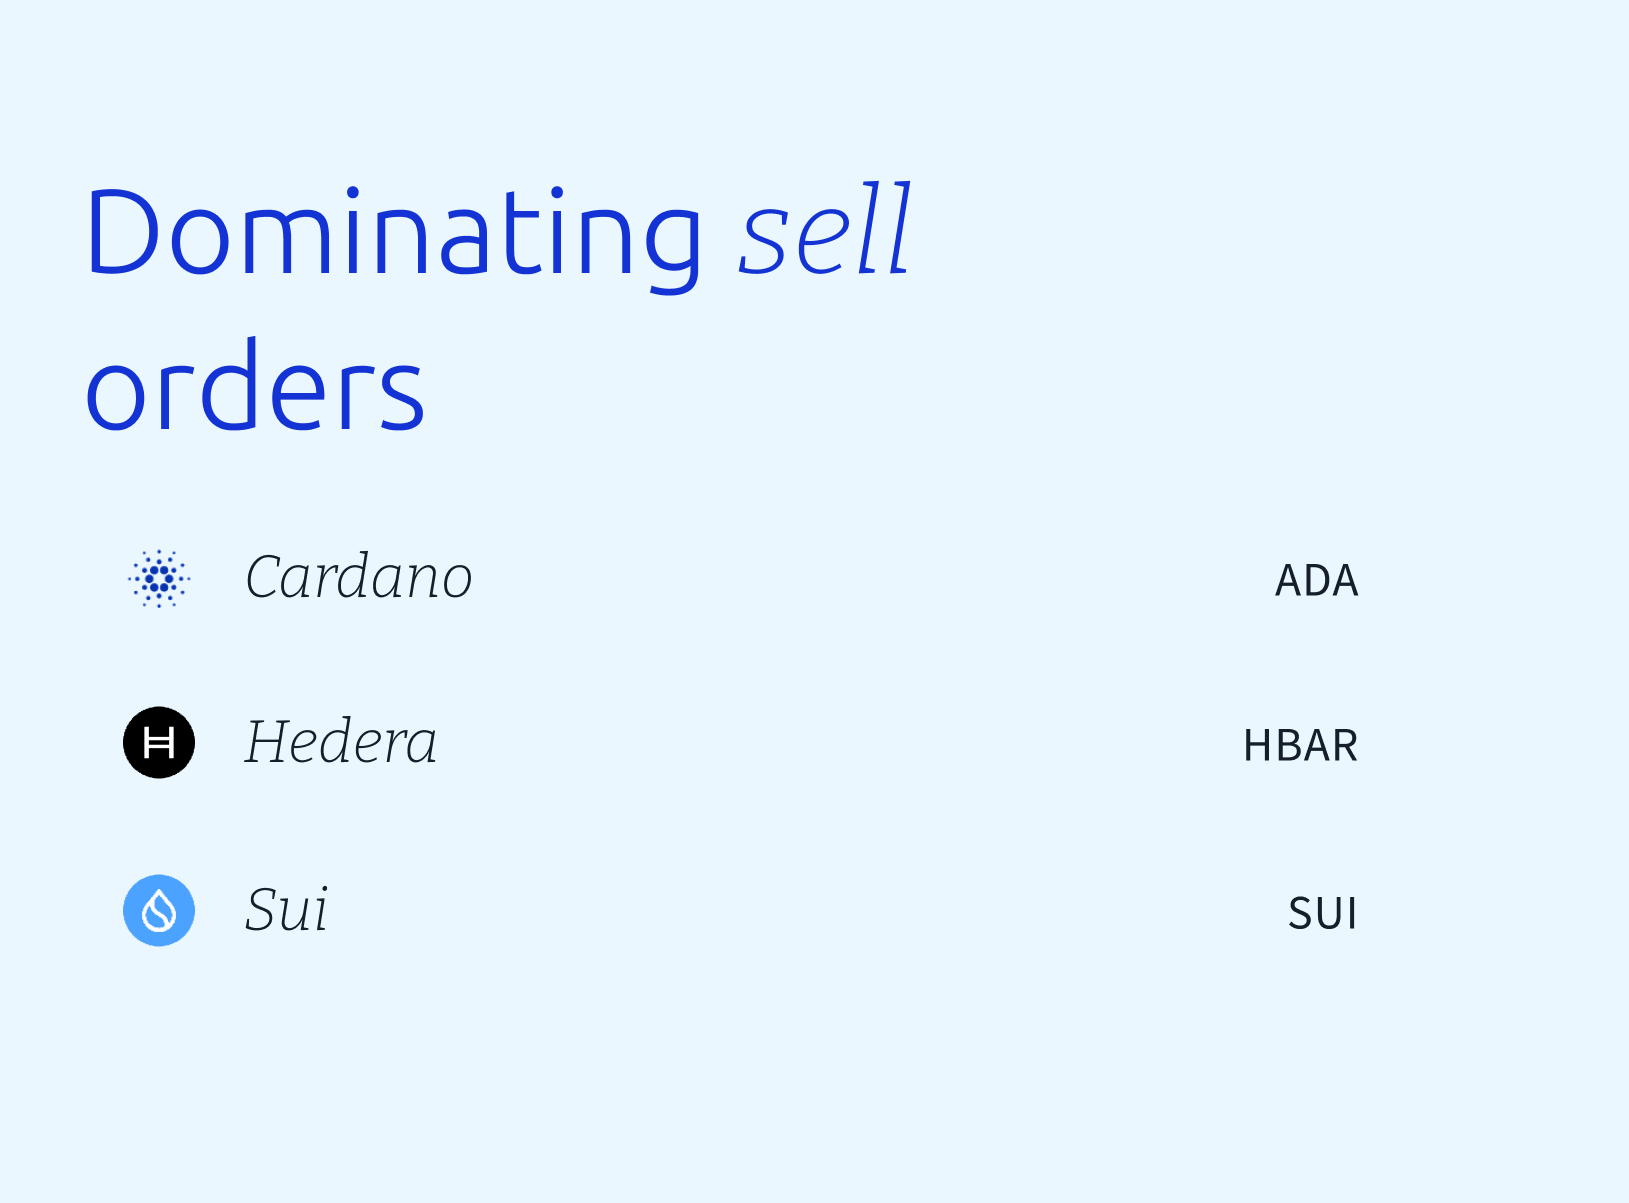
The buy-to-sell ratio for unique Swyftx orders is nominally >$20,000 AUD (rolling data over the last 7 days, captured at 09:00 am AEST).
Disclaimer: The information on Swyftx Learn is for general educational purposes only and should not be taken as investment advice, personal recommendation, or an offer of, or solicitation to, buy or sell any assets. It has been prepared without regard to any particular investment objectives or financial situation and does not purport to cover any legal or regulatory requirements. Customers are encouraged to do their own independent research and seek professional advice. Swyftx makes no representation and assumes no liability as to the accuracy or completeness of the content. Any references to past performance are not, and should not be taken as a reliable indicator of future results. Make sure you understand the risks involved in trading before committing any capital. Never risk more than you are prepared to lose. Consider our Terms of Use and Risk Disclosure Statement for more details.