Key Takeaways
- Measuring market euphoria and performance: How has Bitcoin’s has performed to-date?
- On-chain data for Bitcoin suggests why new buyers have sweaty hands.
- Chart of the week: The rolling 30-day performance of Bitcoin.
To me, it seems the market is at a standstill, with sentiment trapped in purgatory.
It’s partly a gut feeling…but there are several key data points worth unpacking that demonstrate why this may be the case.
In today’s write up we’re going to explore some on-chain metrics and tools like the Crypto Euphoria Index that I’ve created here at Swyftx to give us a perspective check.
At the end of the day the market is human, and anecdotally I’ve heard a near 50/50 split on ‘I can’t wait for Q4’ to ‘Is it the top?’.
So, what’s the go? Is this a reset for the bulls, or are we staring down the kind of reversal that would give bears the clout they’ve been longing for?
Let’s dig in.
Euphoria resetting or reversing?
When trying to understand the markets, using isolated data points never paints the full picture. That’s why you can glean real value from using a condensed data set – like Pav’s own Crypto Euphoria Index, which provides a global view on how the market is currently behaving.
This index comprises altcoin performance, volatility, momentum, volume, derivative market premiums, US dollar strength and Bitcoin dominance in a weighted basket.

The current positioning is 52, close to neutral. A reset back to the middle ground of the index as things got quite euphoric back in July and August.
These metrics backing the euphoria index are at nominal ranges, and things might have just reset.
We can also turn to on-chain data to understand who’s feeling what.
Look on the chain!
If reading the word ‘on-chain’ gave some of you heartburn, fear not! I’m going to show you it’s not that hard to follow. Using on-chain data, we can transparently see how those interacting with the Bitcoin network are acting.
Short-term holders (STHs) are simply people who’ve held their Bitcoin for less than 155 days.
Why does this matter?
Because the behaviour of short-term holders often tells us about market sentiment in real time. They are usually the first to react to price swings, either piling in when prices rise or selling quickly when things turn south.
By tracking the cost basis of these short-term holders (red line below) we can get a clearer picture of where pressure points might form in the market. And for the last few weeks you could see why they may have been hiding sweaty palms, as price has chopped around this short-term holder cost basis.

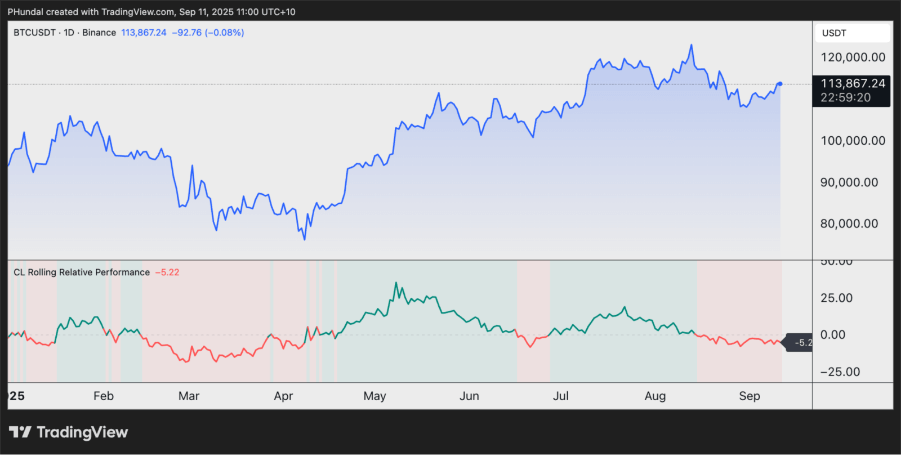
Chart of the week: The 30-day rolling performance of Bitcoin.
And when we look at the relative performance of Bitcoin since the backend of August, it gives some perspective to how these short-term holders might be feeling. When market price (black) is close to the red line, the short-term holders are close to their break-even. That’s the sweaty point where many may be willing to exit, especially after buying around all time highs.
By adding a 30-day lens to Bitcoin’s price action, we can start to understand the short-term market’s motivations and how they may respond to certain price trends.
Right now, anyone who bought Bitcoin 30 days ago is sitting on roughly a -5% loss. For newer or more reactive investors, further downside may very well be enough to trigger doubt and, in some cases, selling.
But when you look at the recent data, this sell-off is becoming something of a regular pattern in 2025.
The year-to-date data below shows that over a rolling 30-day period a sell-off like this is par for the course. And has resulted in a recovery weeks later.
Put it all together, on-chain data and recent 30-day returns on Bitcoin are telling us that we could be at a price level where the pressure on short term holders may be too much for some to bear. This could amplify volatility if we get a sudden sell-off.
But on the flip side, if Bitcoin can climb back above that rolling performance line, this could be the line in the sand that restores confidence.
💱 Swyftx Flows
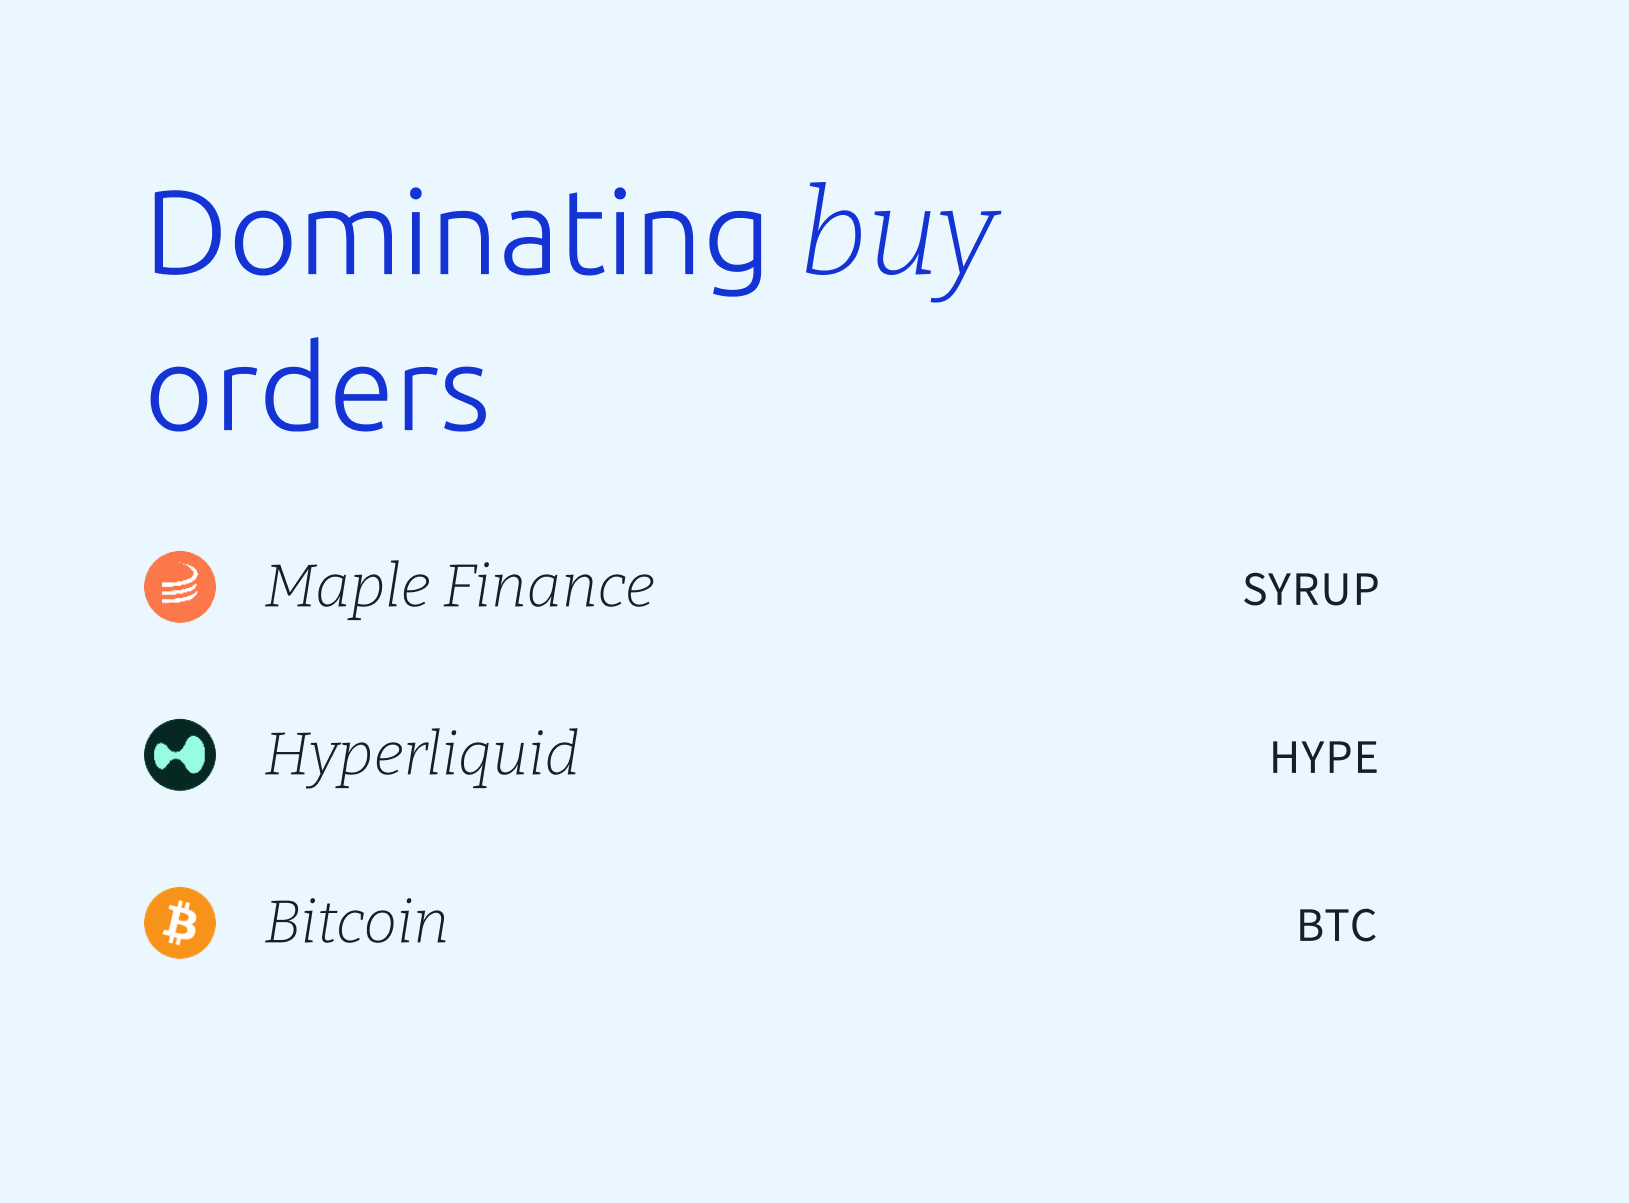
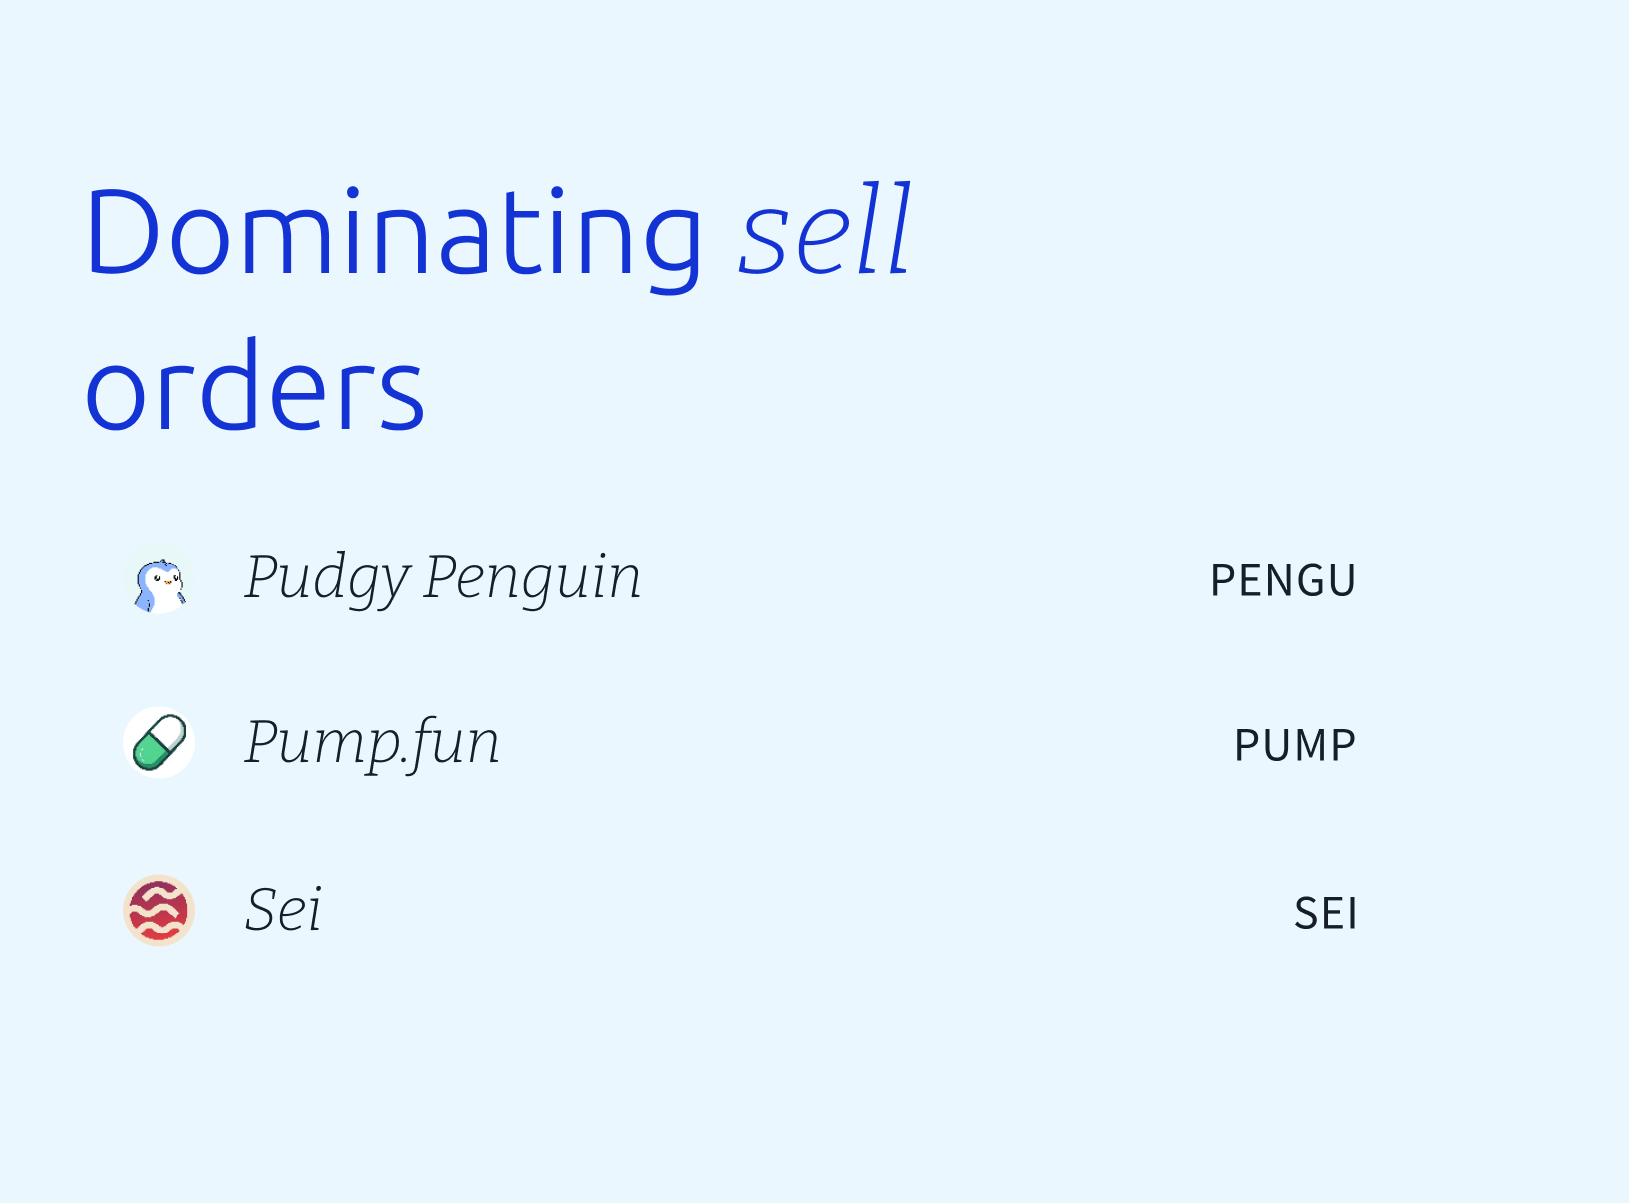
The buy-to-sell ratio for unique Swyftx orders is nominally >$20,000 AUD (rolling data over the last 7 days, captured at 09:00 am AEST).
Disclaimer: The information on Swyftx Learn is for general educational purposes only and should not be taken as investment advice, personal recommendation, or an offer of, or solicitation to, buy or sell any assets. It has been prepared without regard to any particular investment objectives or financial situation and does not purport to cover any legal or regulatory requirements. Customers are encouraged to do their own independent research and seek professional advice. Swyftx makes no representation and assumes no liability as to the accuracy or completeness of the content. Any references to past performance are not, and should not be taken as a reliable indicator of future results. Make sure you understand the risks involved in trading before committing any capital. Never risk more than you are prepared to lose. Consider our Terms of Use and Risk Disclosure Statement for more details.