Key Takeaways
- A look at the Pi Cycle indicator and where we currently sit in its cycle.
- Mapping the demand of crypto from US companies, with an estimated $6.3 trillion AUD currently sitting on balance sheets.
- Despite recent all-time highs, public interest for Bitcoin hasn’t hit peak historical levels.
This week, I thought we should take a step back. We’ve spent a lot of time zoomed in on the current drivers of the market, but sometimes it helps to take pause and take a 30,000-foot view.
However, it’s worth remembering that when we take a broader perspective, it can be easy to get caught up in data models and past cycle analysis. This may mean missing key shifts that make this cycle unique.
But even historical data can give us a framework to understand where we are today.
Near the top, or room to move?
The Pi Cycle indicator is one of the more popular tools you might come across at some stage of your investment journey. This indicator has earned a reputation among traders – because as you can see in previous cycles, it managed to highlight major peaks with noteworthy accuracy.
Of course, no model is perfect, but the value here lies less in prediction and more in the perspective it gives us on how Bitcoin’s cycles have typically unfolded.
The model itself is quite simple. It tracks the relationship between two moving averages:
- The 111-day,
- and the 350-day (multiplied by two).
When the shorter-term average crosses above the longer-term one, that is the crossover event that has historically lined up with market tops.
But right now, we can see that the shorter-term and longer-term moving averages are still quite far apart. This suggests – based on previous data – that a top may not be in yet.

Like I said above, we want to ensure we understand the industry’s whole picture. If something like the Pi Cycle indicator isn’t showing overheating, we need to dig deeper.
What other data is out there to suggest growth is on the horizon?
This is where we need to acknowledge the new tailwinds blowing for the industry: Corporate treasury demands.
The corporate bid
In my eyes, this is one of the clearest new drivers we’re seeing in this cycle. Over the past year, more companies have started to view Bitcoin (and more recently Ethereum) as a part of their balance sheet strategy.
This shift matters because it introduces a different kind of buyer into the market. One that has so far been less driven by short-term sentiment and more by longer-term allocation.
And the data backs this up. Corporate holdings have grown steadily over the last year, this is a structural change in demand that wasn’t nearly as visible in past cycles.
And these new players are here with size. According to data, 3.7 million Bitcoin are currently held be these entities.
That’s a staggering $6.3 trillion AUD at todays prices.

Next, let’s dive into how many people are paying attention to Bitcoin globally. Corporations have arrived – but is the rest of the crowd here yet?
Search trends
Search trends can be a nice way to proxy retail interest. In past cycles, Bitcoin search spikes have lined up with moments of peak euphoria – usually right before major tops.
What stands out in the latest data is how subdued searches remain, even with Bitcoin trading near record highs.
That may suggest the broader public hasn’t piled in yet. Which could mean this cycle still has room to run before hitting the kind of widespread attention we’ve seen in the past.

So, what do we know.
Traditional models like Pi Cycle aren’t flashing the same overheating signals we’ve seen in past peaks. At the same time, we’re witnessing new structural drivers, like corporate treasury allocations, adding a different layer of demand. And interestingly, search trends suggest the wider retail crowd hasn’t fully arrived yet.
That combination of this technical and fundamental measures suggests things aren’t necessarily overheated. Again, this doesn’t guarantee what comes next, but it does hint that 2025’s bullish momentum may not be dead in the water yet.
💱 Swyftx Flows


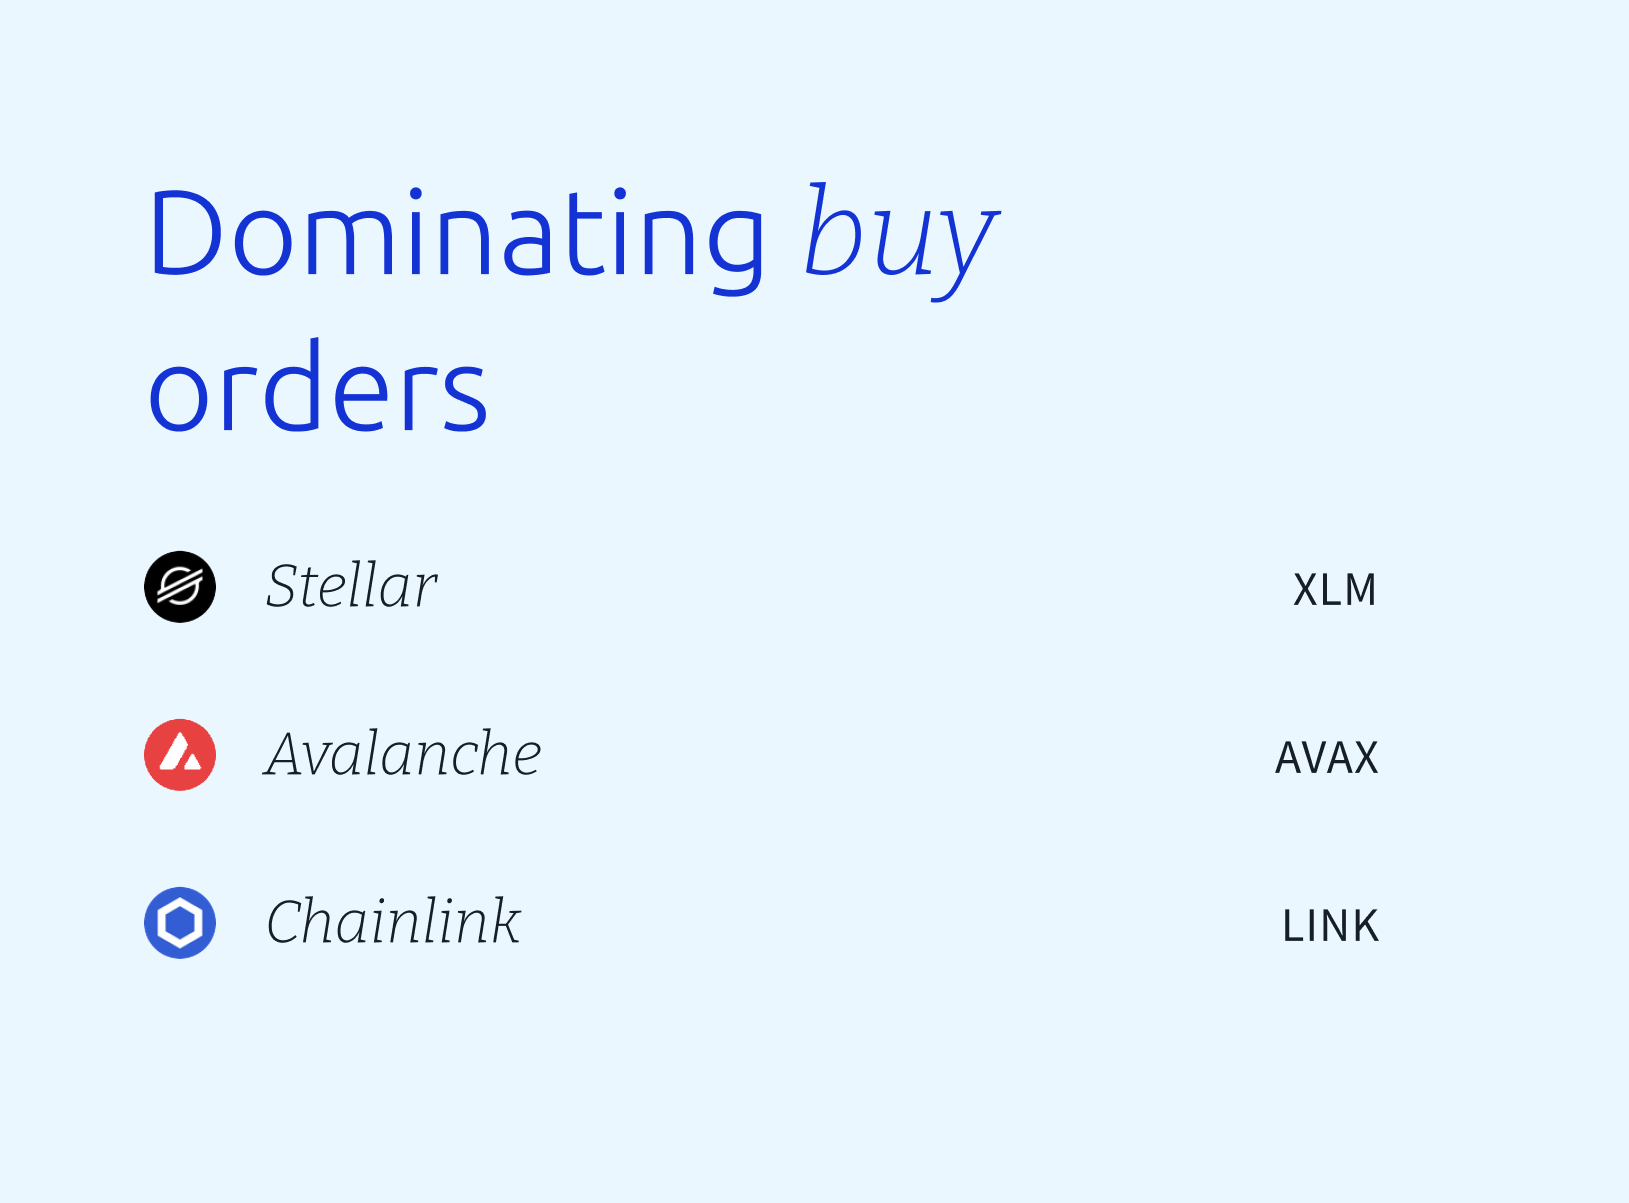
The buy-to-sell ratio for unique Swyftx orders is nominally >$20,000 AUD (rolling data over the last 7 days, captured at 09:00 am AEST).
Disclaimer: The information on Swyftx Learn is for general educational purposes only and should not be taken as investment advice, personal recommendation, or an offer of, or solicitation to, buy or sell any assets. It has been prepared without regard to any particular investment objectives or financial situation and does not purport to cover any legal or regulatory requirements. Customers are encouraged to do their own independent research and seek professional advice. Swyftx makes no representation and assumes no liability as to the accuracy or completeness of the content. Any references to past performance are not, and should not be taken as a reliable indicator of future results. Make sure you understand the risks involved in trading before committing any capital. Never risk more than you are prepared to lose. Consider our Terms of Use and Risk Disclosure Statement for more details.
