Key Takeaways
- Bitcoin has hit new all-time highs overnight and continues to push upward.
- Exchange-traded funds (ETFs) in the US have seen over $1 billion USD in net buying activity since Monday.
- Chart of the week: BTC vs Gold – is Bitcoin about to steal the spotlight?
It’s been an absolute rollercoaster of a 2025 to say the least but we made it…again!
After the year that’s been I’m sure many would have forgotten that this is actually the second time we have made all-time high on Bitcoin in 2025, the first occurring back in January this year.
And while this is a very exciting time for us all, it’s understandably simultaneously a nerve-racking decision one for many. Last time we broke into new all-time highs, four weeks later we saw a -14% decline in BTC’s price and the start of Trump’s tariff turbulence.
For that reason alone, I wouldn’t be surprised to hear some chips are being taken off the table. But, even with another ATH in the rearview, the data tells us that there is still growing demand for Bitcoin.
Institutional demand returns
Institutional funds are back in the green, posting five consecutive trading days of positive inflows. Since Monday alone we’ve seen in excess of $1 billion USD in net ETF purchases.
The image below shows how these net flows evolved in recent times as the optics on the global tariff situation have shifted. Calm and constructive posturing between global leaders in the recent weeks have likely added to this positive sentiment shift.
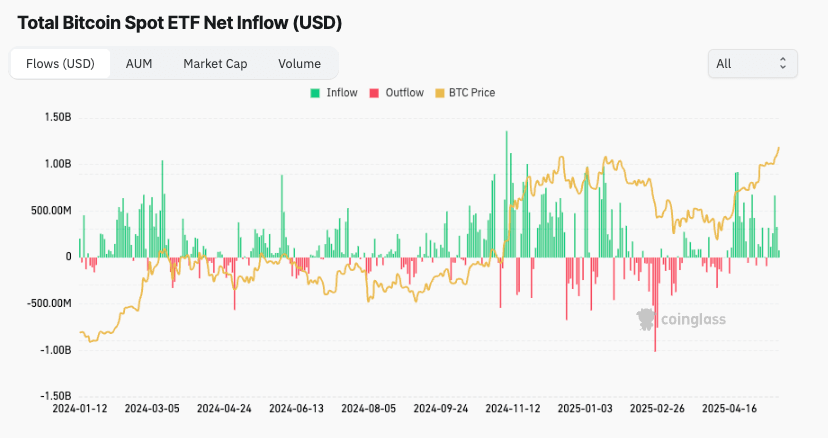
Chart of the week – BTC vs Gold – is Bitcoin about to steal the spotlight?
During the recent periods of global unrest, it’s not a revelation that there’s been a flight to safety for capital flows. We can see this in the record-breaking price movements in gold these last few months as demand surged.
But, now that we are seeing calmer waters on the geopolitical scene, will we start to see a rotation back to other assets, like Bitcoin? This is an important chart to watch in the coming months to help answer that question.
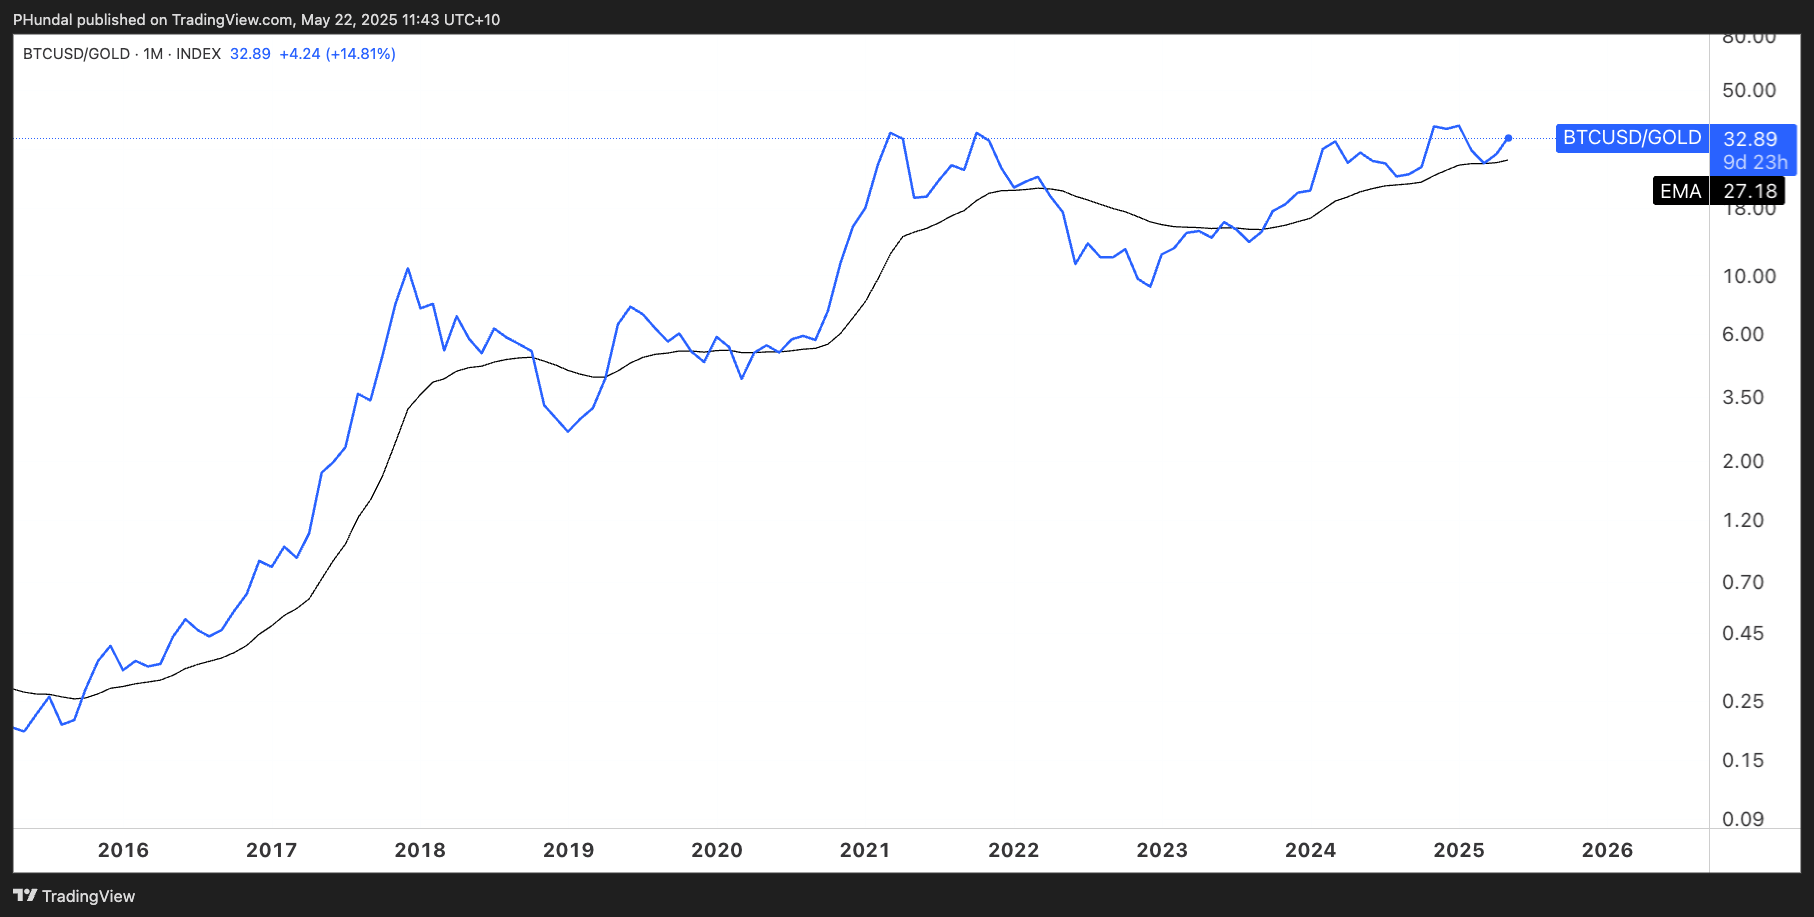
The above chart compares the monthly performance of Bitcoin to gold. Between 2023 and 2024 there has been a shift in relative strength in favour of Bitcoin. It has, on average, outperformed gold most of this time – however not so much in the last few months of 2025…thank you trade war.
Should we start to see Bitcoin continue its upward momentum on this chart, there is a real chance we get a relative strength breakout in Bitcoin vs Gold – like in 2017 and 2021 looking at the historical data.
What’s important to know is that this has previously lined up with breakouts in the regular Bitcoin/USD etc. charts and kicked off what you could call the ‘bull market mania’ phase.
Interesting times ahead!
💱 Swyftx Flows
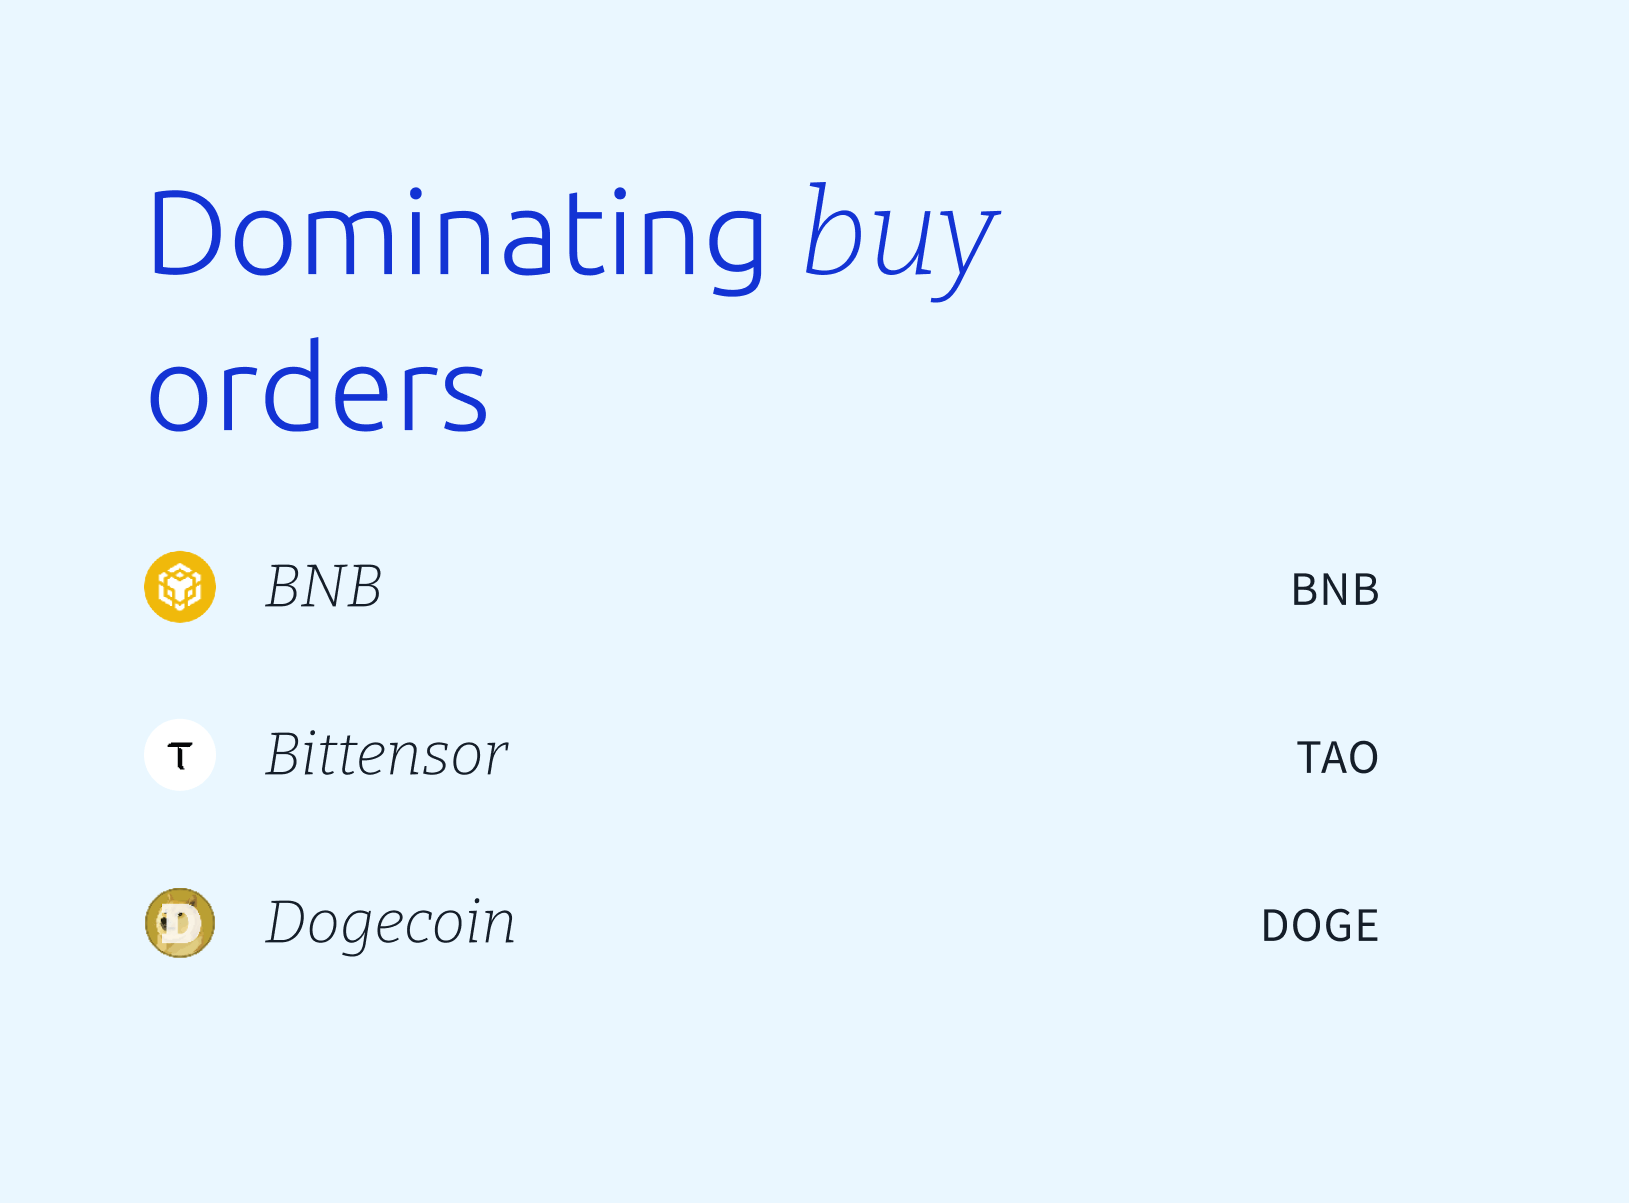

The buy-to-sell ratio for unique Swyftx orders is nominally >$20,000 AUD (rolling data over the last 7 days, captured at 09:00 am AEST).
Disclaimer: The information on Swyftx Learn is for general educational purposes only and should not be taken as investment advice, personal recommendation, or an offer of, or solicitation to, buy or sell any assets. It has been prepared without regard to any particular investment objectives or financial situation and does not purport to cover any legal or regulatory requirements. Customers are encouraged to do their own independent research and seek professional advice. Swyftx makes no representation and assumes no liability as to the accuracy or completeness of the content. Any references to past performance are not, and should not be taken as a reliable indicator of future results. Make sure you understand the risks involved in trading before committing any capital. Never risk more than you are prepared to lose. Consider our Terms of Use and Risk Disclosure Statement for more details.