Support and resistance levels are one of the most important concepts in technical analysis. They show areas where uptrends and downtrends are likely to halt. Knowing how to use and identify support and resistance levels is a big step towards making smarter trades. This article will explain the concept of support and resistance levels, how to identify them, and some important things to consider.
What are support and resistance levels?
Support and resistance levels are one of the most important concepts used in technical analysis (TA). Technical analysis uses chart patterns and market data to identify trends and predict market movements.
The concept of support and resistance levels is quite simple. They are points on a chart where the price was previously unable to break through due to increased buying or selling pressure. Horizontal lines usually depict these levels.
Support levels occur during a downtrend where buyers begin to outweigh sellers and bearish momentum is halted (Figure 1).
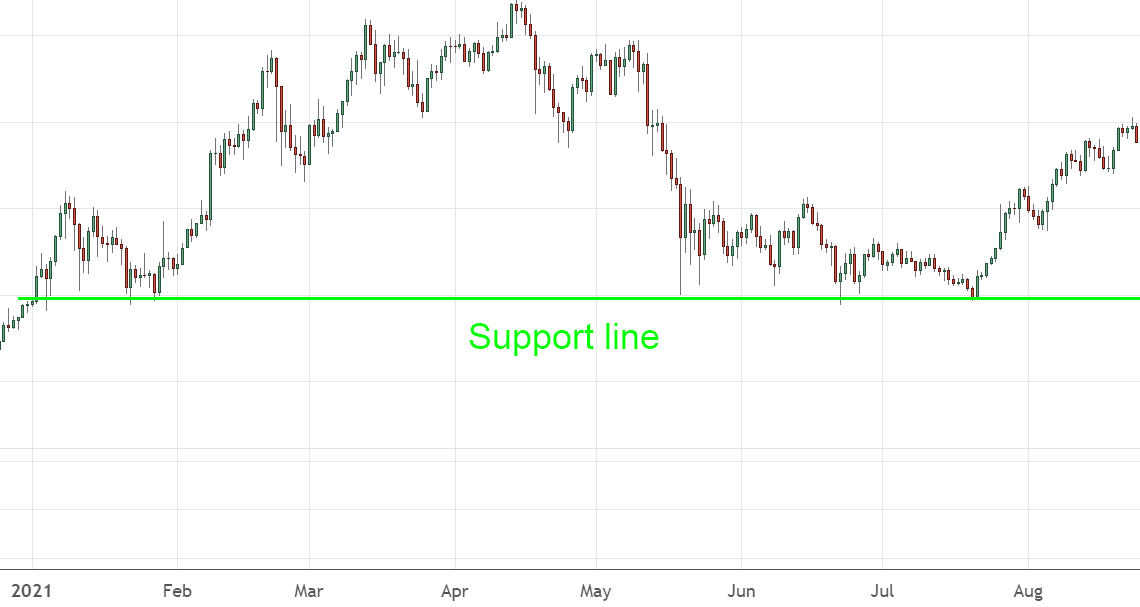
Figure 1 – A support line indicating buyers taking control
On the other hand, a resistance level is a point where an uptrend peaks and the crypto starts getting sold off (Figure 2).
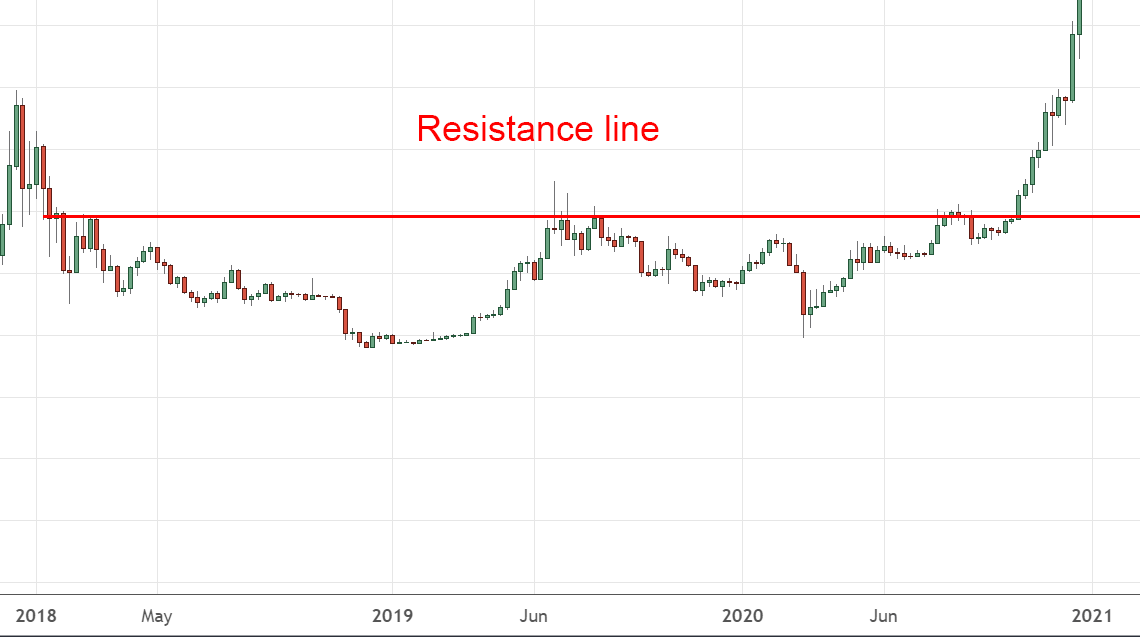
Figure 2 – A resistance line indicating sellers taking control
Support and resistance levels aren’t impenetrable, there will be times when these levels are broken. Often when a price breaks through these levels, there will be a period where the market trades sideways before it makes its move towards a new support or resistance level.
The market is like a battlefield, buyers are constantly fighting with sellers. If the price is rising, it means that the buyers are winning the battle, and if the price is falling, the sellers have the upper hand. Support and resistance levels are key locations that are hard for the opposing side to take over but once captured, it will be just as hard to retake. When a price breaks above a level of resistance, that level could turn into a new level of support later. The same can happen in reverse as well.
Key Takeaway
Support and resistance levels are areas likely to have an increase in buying or selling pressure, potentially changing the direction of the market.
How do traders use support and resistance levels?
Cryptocurrency is no stranger to market volatility. But sound knowledge of support and resistance levels allows traders to create better trading strategies. Support and resistance levels are important turning points in the market; many traders will pay close attention to these areas, increasing liquidity.
Each time an asset is sold, a corresponding buy offer needs to be matched, the same concept with buying. That’s why whales (investors with large amounts of crypto) are more likely to enter and exit positions here as their trades require large amounts of liquidity.
Traders tend to trade around support and resistance levels. Entering just above the support level can be a rewarding strategy. When a price bounces off the support level, it is likely to rise until it reaches a level of resistance. Placing a stop-loss just under the support level is a great way to mitigate losses in case of a continuous downward trend. Price can struggle to break past resistance levels; the area just under the resistance level is often a good place to exit a trade.
Different ways to calculate support and resistance levels
Basic support and resistance
The quickest and most common way to find support or resistance levels is to simply draw a horizontal line between past lows (support) or highs (resistance). This is demonstrated in Figures 1 and 2 above. The easiest way to do this is by using the Trend Line tool on a TradingView chart. This tool helps you draw support and resistance lines on asset chart pages.

The strongest support is generally a level of previous resistance that has been breached (Figure 3). The inverse is also true: the strongest resistance is previous support that has broken.
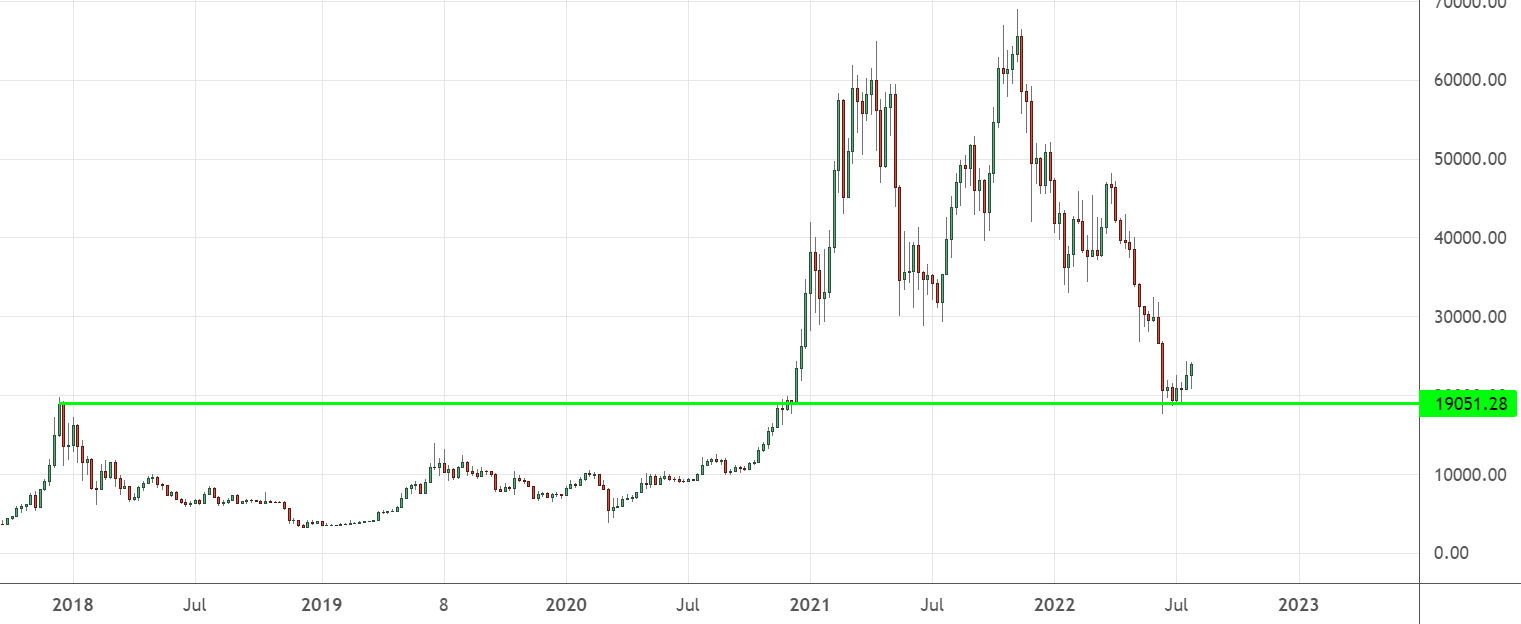
Figure 3 – A strong support level drawn from previous resistance
Psychological support and resistance
Psychological support and resistance are price levels that are resilient because of people’s attitude toward round numbers. Asset prices may struggle to move beyond round numbers. For instance, traders are more likely to buy or sell assets at $100 rather than an obtuse number such as $93.13.
It’s not surprising that the markets revolve around round numbers. This phenomenon correlates with everyday life where numbers tend to be rounded up or down to simplify things. The temperature on an aircon remote goes up by increments of 1 instead of 0.1, and people are more inclined to set the microwave for 30 seconds instead of 21.
Bitcoin is a perfect example of this. Bitcoin’s price history is riddled with support and resistance levels hovering at nice round numbers. In the first five years of Bitcoin’s existence $1, $100, and $1,000 were all key levels of support and resistance. More recently, those numbers have gotten much larger, but whole numbers still remain very important (Figure 4). It is no coincidence that Bitcoin’s all-time high was just below $70,000 USD.
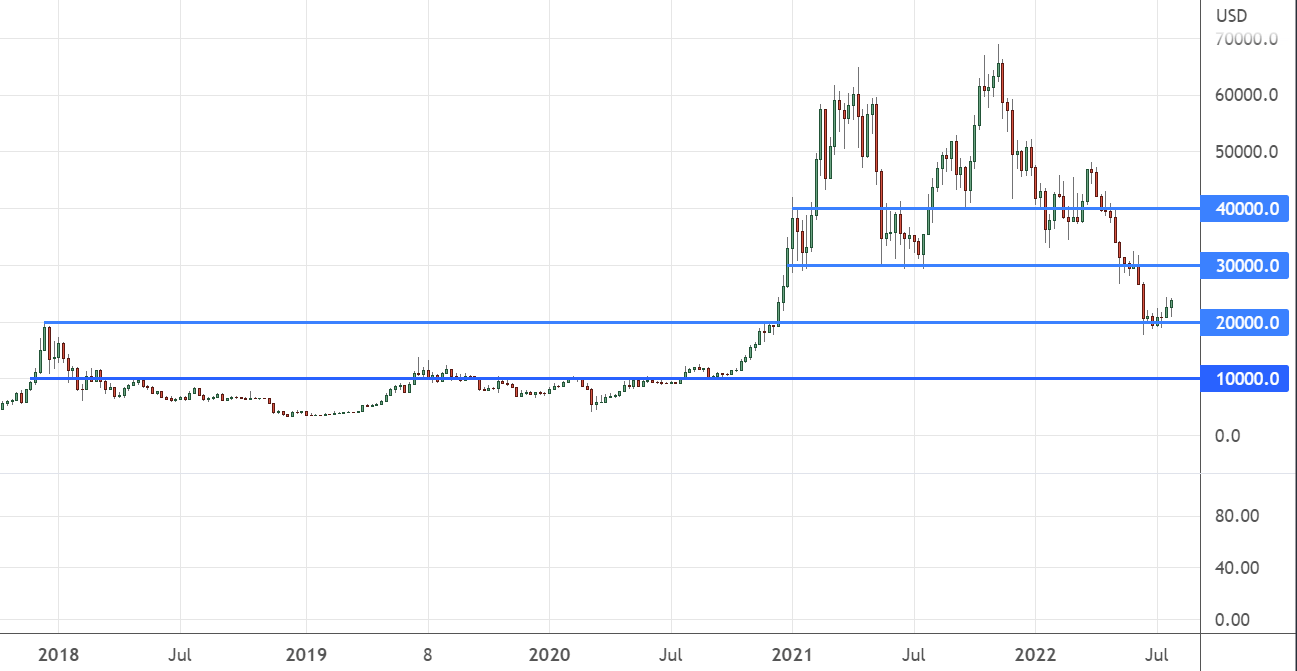
Figure 4 – Key psychological levels on the BTC chart in the last four years
Trendline support and resistance
Support and resistance levels can be in the form of trend lines. These trendlines can be upward sloping (uptrends) or downward sloping (downtrends). Similar to horizontal support and resistance lines, there is a high chance that the price will bounce off the trendline (Figure 5).
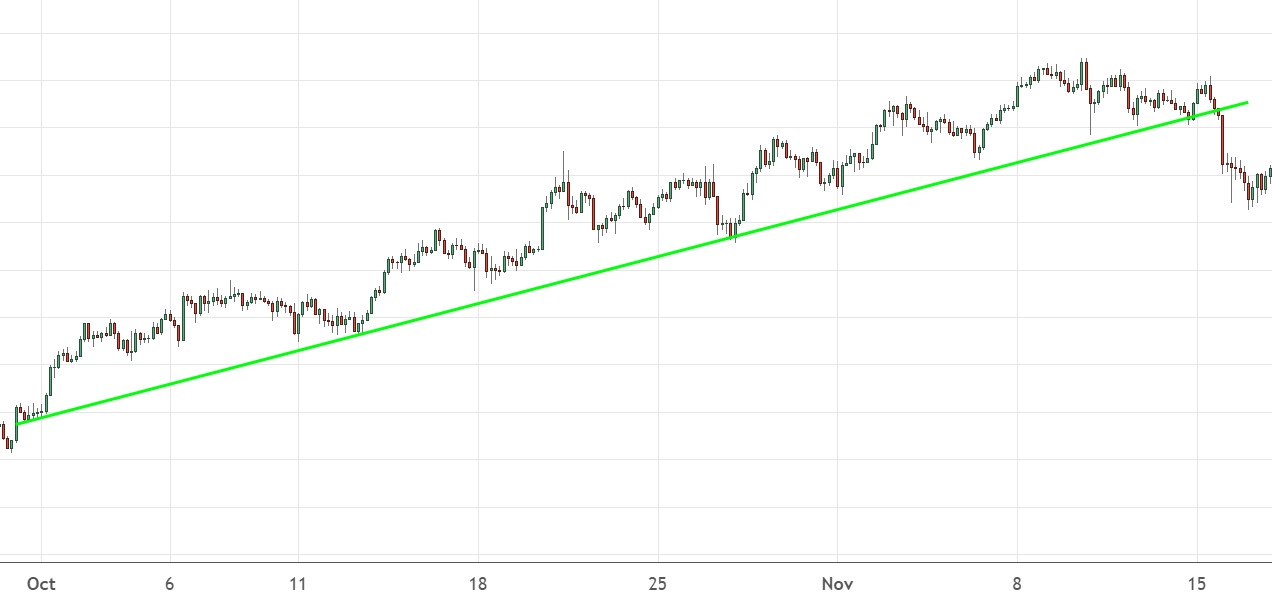
Figure 5 – An upwards sloping trendline (uptrend)
Moving average support and resistance
Technical indicators are also used to track levels of support and resistance. A moving average is a popular technical indicator that’s based on past price data. It’s a great tool for identifying market trends. This indicator is represented by a dynamic moving line, it acts as a support when the price is above the line (Figure 6) and acts as resistance when the price level is below the line.
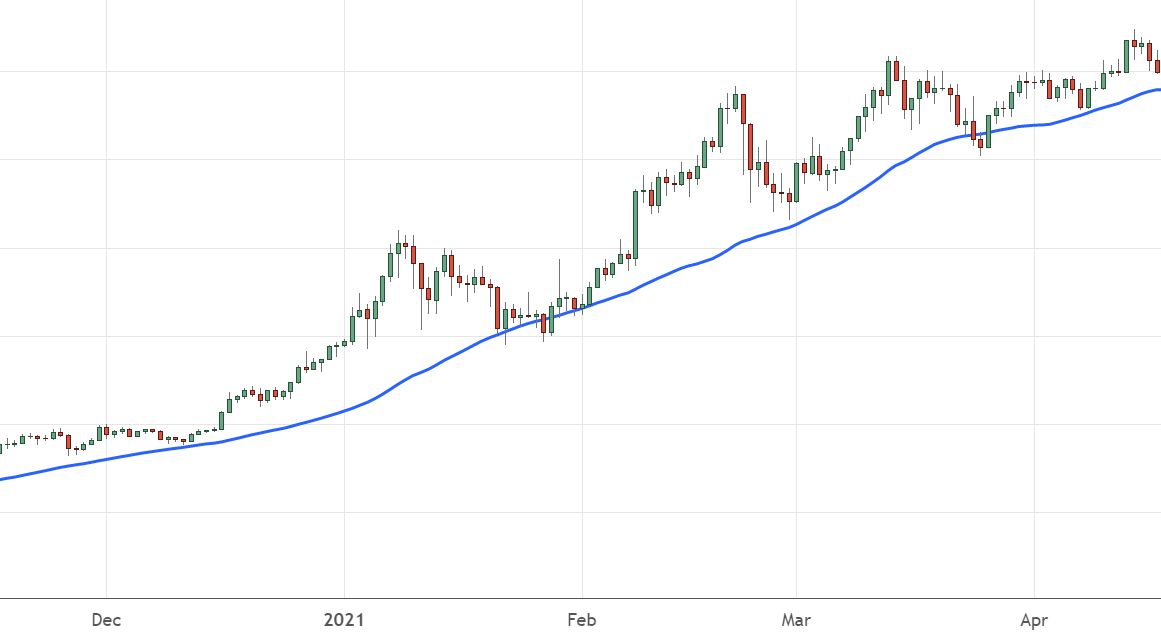
Figure 6 – A moving average acting as a dynamic support line
Fibonacci support and resistance levels
The Fibonacci retracement tool (Figure 7) is a set ratio that generates support and resistance levels. These ratios are derived from the famous Fibonacci sequence that commonly appears in nature. Interestingly, the Fibonacci sequence does not include anything relating to 50% but is included in the Fibonacci retracement tool because it was discovered to be very useful.
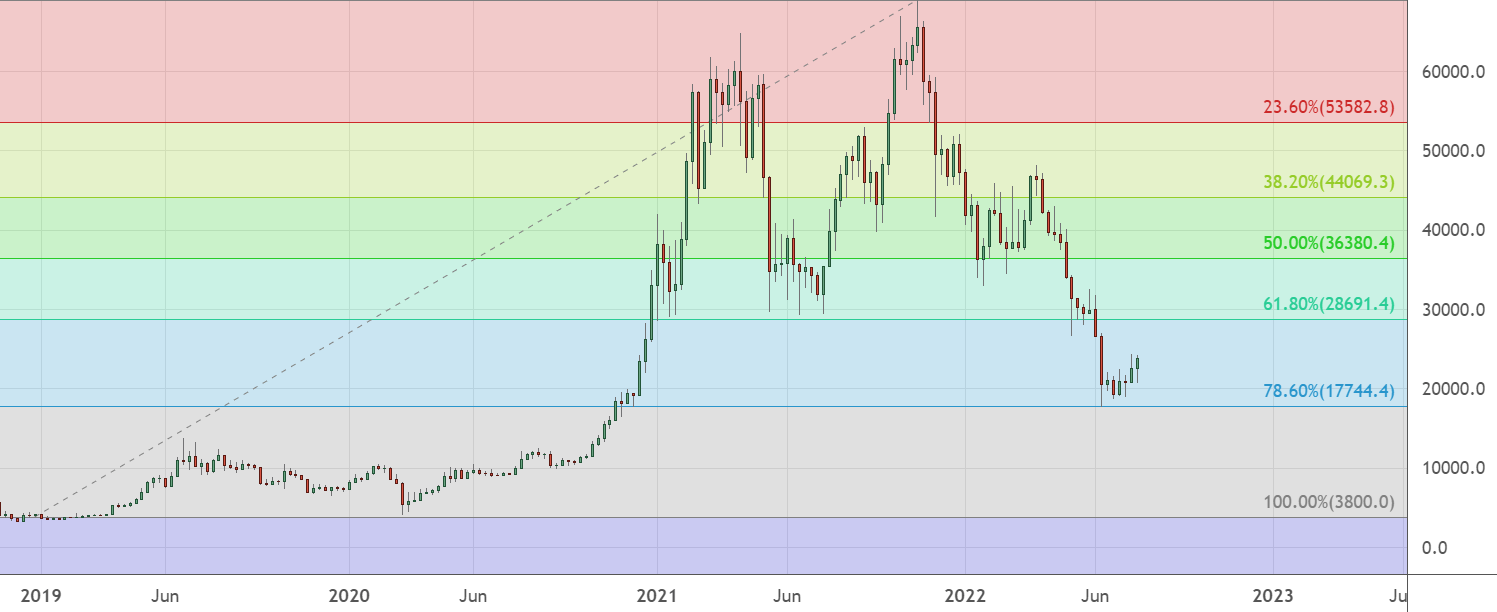
Figure 7 – Support and resistance levels depicted by the Fibonacci retracement tool
Using the different methods together
Solely relying on one indicator is risky. Getting a second opinion and having multiple confirmations from different indicators is generally a better approach to trading.
For example, a level that aligns with a key Fibonacci level, a round number, and has previously been a level of support will be a much stronger level than a point that only rests on a round number.
Multiple confirmations boost your trading strategy’s effectiveness but do not always guarantee successful results.
Other considerations
Number of touches
The more times a price tests a level of support or resistance, the more resilient that level becomes. History has a way of repeating itself, so traders like to remember past prices that have been key turning points. Buyers gain more confidence at levels where prices have continuously bounced off support levels.
Preceding price move
Support and resistance levels are also stronger when the preceding price trend is steep. The quicker the uptrend, the stronger the resistance. The speed of which the price moves is also known as momentum, the greater the momentum, the more likely its recognized to be overbought or oversold.
Levels vs zones
Generally, support and resistance levels are horizontal lines on the chart, whereas support and resistance zones are a range between two levels (Figure 8). This highlights an area of support or resistance, rather than a specific and fixed level.
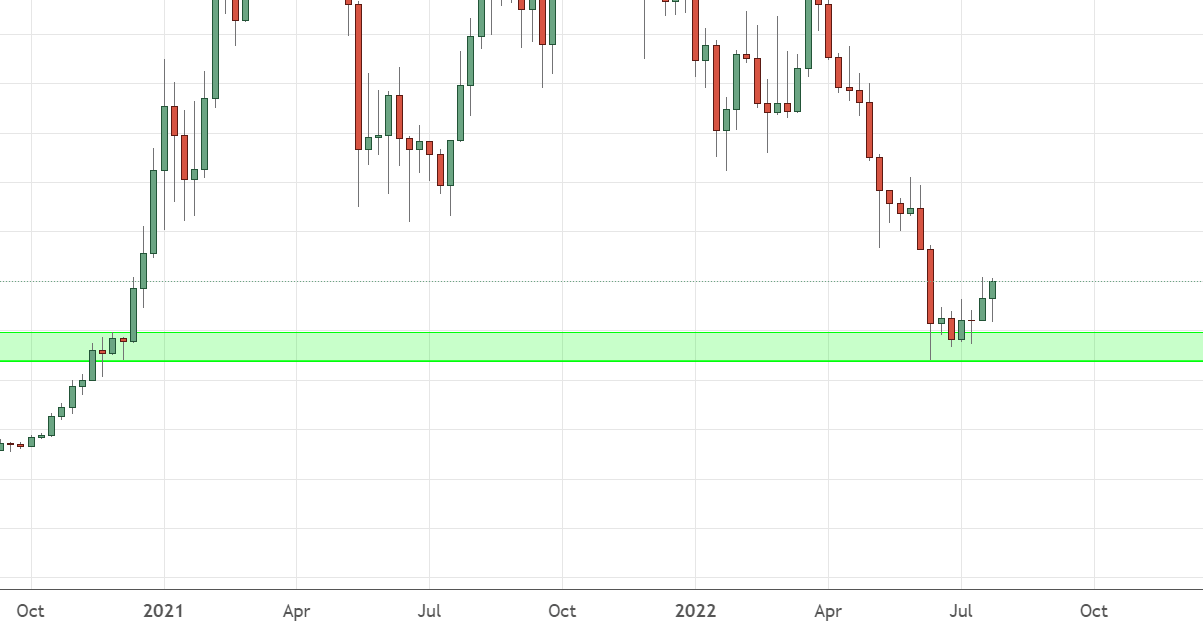
Figure 8 – A support zone that indicates an ideal buying area
Volume
It is important to consider the trading volume at price levels. The larger the volume traded, the stronger the support or resistance level is likely to be. When an asset reaches a support level and bounces with high trading volume, the next time it reaches that price it will most likely be met with high buying pressure.
Key Takeaway
Volume can be interpreted as an election. If only a handful of people voted, the results are much less significant than if most of the country voted.
Time
Consistency is key when it comes to major support and resistance levels. If a support or resistance level is tested consistently over a long period of time, it is more resilient than a support and resistance level that was created recently.
Summary
Identifying support and resistance levels is fundamental to technical analysis. They show key areas on the chart where buying and selling pressure is likely to increase. Technical, psychological, and natural methods are used to identify support and resistance levels. Although these methods can be accurate at times, it is precarious to rely on one method exclusively. A more effective approach is to look for confluent events involving multiple indicators and techniques.
Disclaimer: The information on Swyftx Learn is for general educational purposes only and should not be taken as investment advice, personal recommendation, or an offer of, or solicitation to, buy or sell any assets. It has been prepared without regard to any particular investment objectives or financial situation and does not purport to cover any legal or regulatory requirements. Customers are encouraged to do their own independent research and seek professional advice. Swyftx makes no representation and assumes no liability as to the accuracy or completeness of the content. Any references to past performance are not, and should not be taken as a reliable indicator of future results. Make sure you understand the risks involved in trading before committing any capital. Never risk more than you are prepared to lose. Consider our Terms of Use and Risk Disclosure Statement for more details.